A Data-Driven Strategy for Teaching
A Data-Driven Strategy for Teaching

Associate Professor M. Keith Chen’s research blurs traditional disciplinary boundaries, bringing unorthodox tools to bear on problems at the intersection of economics, psychology and biology. Chen also consults and advises numerous companies, most recently as head of economic research for Uber, where he redesigned Uber’s dynamic “surge” pricing model.
Some UCLA Anderson courses have been taught for decades. The substance of the courses evolve, of course, but marketing, finance, strategy, operations and the like are traditional and foundational topics covered by Anderson and every other graduate business program. A class focused on technology analytics, though, is a more recent phenomenon, representing an evolution in curriculum that meets the interests of today’s students as well as a data-centric external marketplace, where Anderson students will pursue their careers. Technology Analytics, developed by Chen, entails both a new approach to teaching strategy and a deep dive into the business world’s latest analytical techniques.
Q: What is the genesis of your course, Technology Analytics?
This course evolved as a result of our Master of Science in Business Analytics (MSBA) program, the new degree in data analytics that’s kind of a hybrid data science master’s degree and business master’s degree. In developing that program we thought it needed a strategy course, like a business strategy course, but the way that we traditionally teach business strategy [in the MBA programs] didn’t feel right.
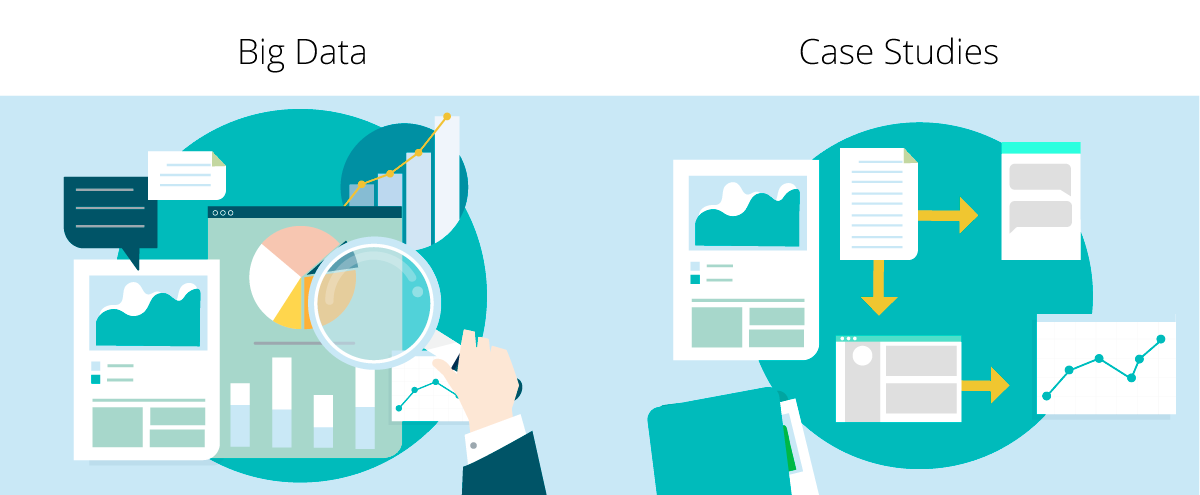
We traditionally teach business strategy by using case studies developed at Harvard. Students read a case and then they analyze the decisions made by the company. As a result, [students] almost think analogically with respect to the cases they learn. But when I was spending time in the tech industry, I realized that modern firms, especially technology firms, don’t make decisions this way anymore because that mode of decision making is less effective in a setting where you have a tremendous amount of data.
So, the idea here was to design a strategy course with traditional strategy topics, but instead of doing case studies we give students an example of a big data set, and we look at the decisions that the firm made using that data. We just do that over and over and over again.
I use a lot of data from Uber, Amazon, eBay, Netflix and Roku, and we talk about how the practice of strategic decision making has been transformed by big data environments. I developed the class as the core strategy course for MSBA and then I offer a parallel class in the MBA program for students who want to learn these tools.
Q: You’re not only a teacher and researcher, you’ve had years of practical industry experience. How does that inform this course?
I use a lot of examples from when I was the head of growth strategy and economic research at Uber. We had $20 million to spend to drive growth. Based on U.S. city growth data, we had to decide how and where to allocate resources based on the data. The question was, should we spend more on acquiring more drivers or should we spend it more on acquiring riders? That was a big project that we did in class. We would learn techniques for analyzing large amounts of data to answer those questions.
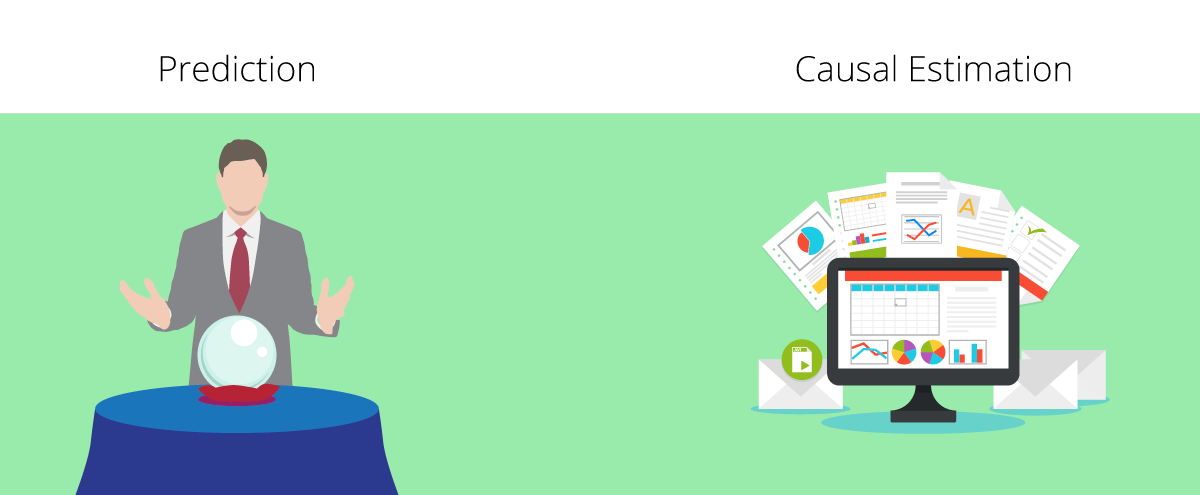
There is an aspect to this course that is unique, as far as I can tell. The MSBA curriculum has a lot of advanced machine learning courses that are almost entirely focused on prediction. What we do in this course, because we’re trying to make large corporate strategic decisions, is flip that and focus a lot on big data techniques aimed at causal estimation, and [we] learn the difference between those two things.
When you’re making strategic decisions, what you need to know is not just which cities are growing fast and which cities are growing slow, but also, if I were to intervene and add an extra million dollars to this city, how fast would it grow in that counter-factual world? That part of data science is called causal estimation. It’s a fundamentally different set of tools because it’s basically about figuring out what patterns we see in big data that are purely correlational and what patterns can be interpreted, [and] not just X and Y that can be related.
Q: What are the assignments like for this course?
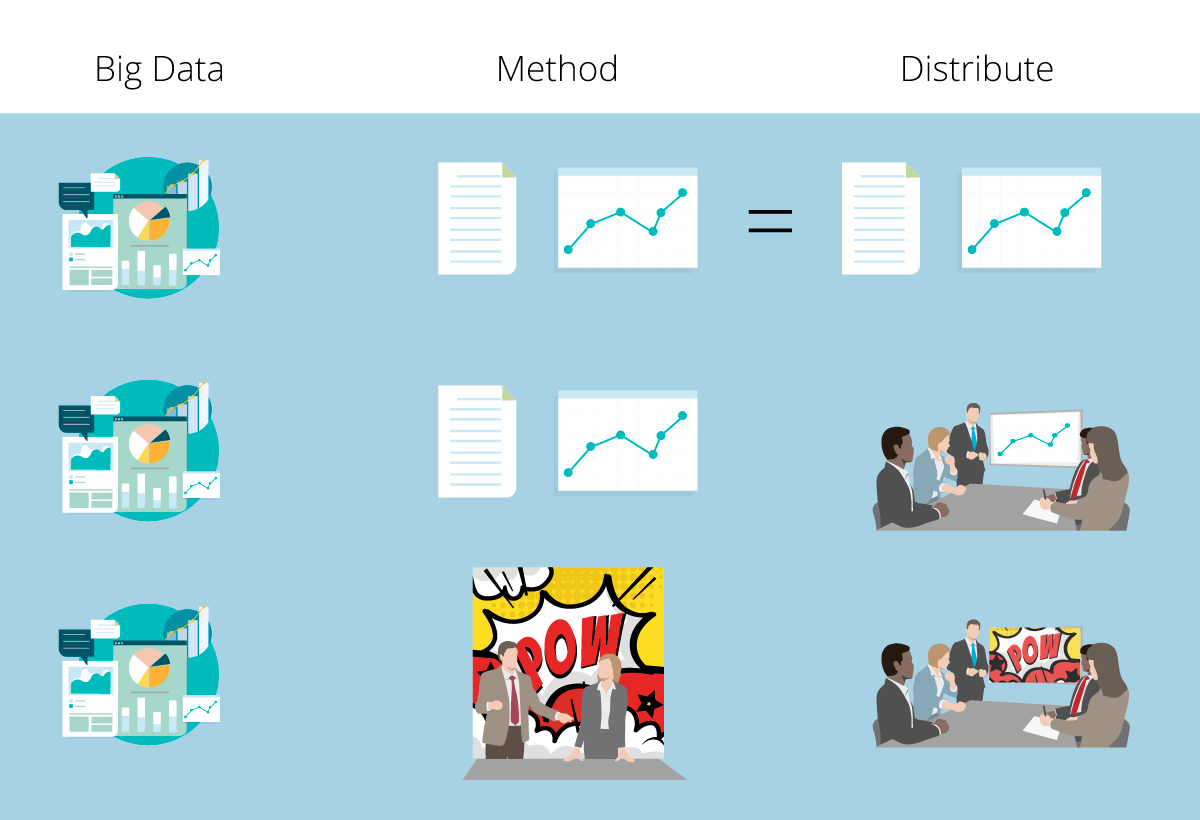
There are two kinds of assignments. In one, we’ll give students a data set and they analyze this data to come up with this causal analysis of a casino’s promotions program, their high-roller promotions program. In this case, it’s an analysis that scholars already ran; I want students to replicate that and show me that they know how to use this tool by just replicating their analysis. That’s the simplest one.

In the second type of assignment, I give this data set and tell students what kind of analysis I need them to do I’m not even going to give them an example of how’s it been done. They do it, then we get back together in class and everybody’s going to spend 10 minutes presenting their analysis. There’s inevitably a lot of variation and differences between these analyses, and we talk about best practices.
The last kind of assignments [teach] them new high-tech tools. I show them this kind of new technique that’s very powerful and I kind of bill it and sell it as a super power. I tell the class that this is the thing that will most differentiate you when you’re out there because it’s both incredibly useful and an incredibly powerful statistical technique and almost nobody knows how to do it. We spend a week learning the technique then I ask students to identify a problem from the industry that they’re working in that can be analyzed using this technique. If we can gather the data then we’ll actually do it. But if we can’t gather that data, we write up a detailed plan of how one would analyze that question if one had this data. In this case, we flip the problem. I want students to show me that they know how to do the analysis. We want the class to find a place where these techniques may be used and where people haven’t thought about using it before.
Q: How do you evolve the course in what is an ever-evolving space?
That’s one of the most fun parts of this. I feel like at least a third of the material every year has been completely new since the year before. New data [comes] from new companies. Sometimes even alumni who took this course in previous years come back from their internship and say, we had this problem and here is the data we used in analyzing it. They ask me for help analyzing it and I usually help them think through those kinds of interesting issues. And I say, “By the way, can you ask your company would it be cool if we use this data in the course for next year?” A lot of times they say yes.