May 2021
May 2021
To Close or Not to Close: Public Health Interventions and the Economy
Economic Update: A Disappointing Jobs Report and Much Ado About Inflation
- Real GDP grew at a 6.4% annualized rate in Q1 2021, according to advance estimates. This is an increase from a 4.3% annualized rate in Q4 2020. The increase reflects higher personal consumption expenditures (more so on goods than services), business investment in equipment, residential fixed investment, and government spending.
- The May Jobs Report was disappointing, with 266,000 additional nonfarm payroll jobs recorded in April. Economists were expecting approximately 1.0 million jobs to be added, and potentially as many as 1.4 million jobs. Gains in April were led by leisure and hospitality and local government education. Sectors that lost employment were grocery stores, general merchandise stores, messengers/couriers, temporary help services, and manufacturing of autos and parts. This reflects a transition from the stay-at-home economy where we consume more from supermarkets and delivery to one where we go out more. It also reflects supply constraints in manufacturing.
- There is a lot of debate on whether expanded unemployment insurance (UI) might be contributing to labor shortages and dampening employment gains. It’s unlikely that this is the main factor. First, the sector that added the most jobs is leisure and hospitality, where wages are lower and where expanded UI would be more likely to have a disincentive effect. Second, states with more generous UI benefits actually added more jobs than states with less generous UI benefits. Finally, what’s the counterfactual? Without expanded UI, consumers would have less disposable income, which might reduce demand and employment more than any disincentive effect from more generous UI. A more likely culprit might be ongoing childcare constraints and school-from-home (notably, men gained jobs in April, women did not), ongoing fears of COVID exposure at work, and supply chain bottlenecks. It’s important to also keep in mind that this is one report. One report does not make a trend.
- I discussed inflation numbers in a recent CBS Evening News interview. It’s always possible to go through the Consumer Price Index and find line-items that have the largest price increase. While the CPI Index is up 2.6% year-over-year overall, it’s only up 1.6% excluding food and energy. Food prices have actually stabilized. Most of the increase in food-at-home prices occurred in March through June of last year and have remained high since then as we continue to buy more food from grocery stores and less from restaurants. But notably, food-at-home prices have stopped increasing. Where we’re seeing increases is in gas prices, which have rebounded to pre-pandemic levels. We’re going to see some spikes in price levels as supply catches up to demand, but so far, this is nothing unusual. We’ve experienced transitory spikes in prices even during low inflation periods (e.g., in July 2018 and February 2017).
A Conversation with Jerry Nickelsburg and Emil Verner
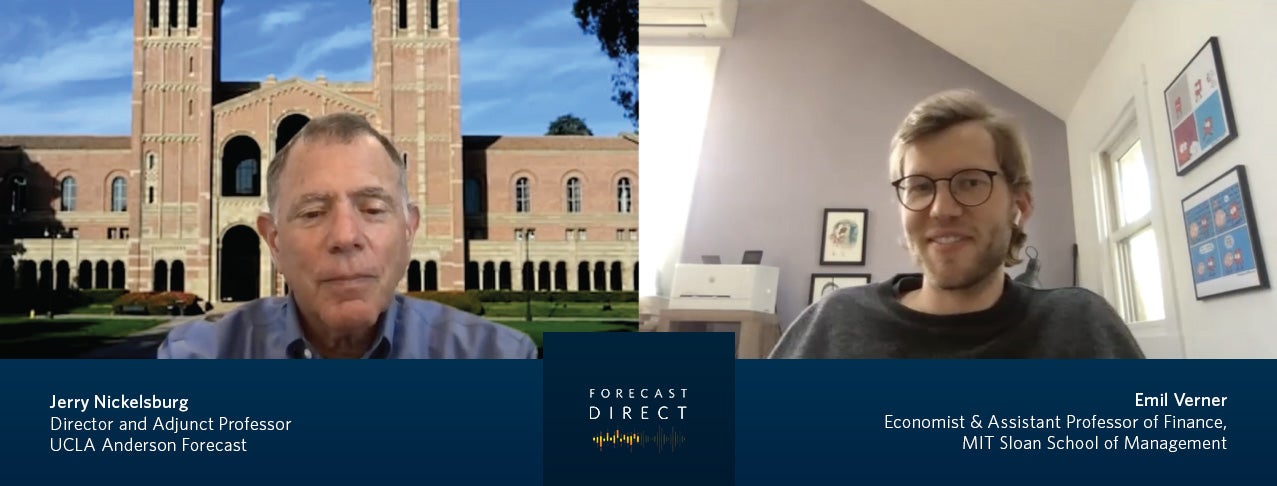
For this edition of Forecast Direct, we talk with Emil Verner of the Massachusetts Institute of Technology about whether pandemics or public health interventions depress the economy. Following is an edited summary of the conversation.
Jerry Nickelsburg (JN): You recently published a paper, “Pandemics Depress the Economy, Public Health Interventions Do Not: Evidence from the 1918 Flu,” with co-authors Sergio Correa and Steven Luck. This is a different topic than your previous research in finance. What struck you as interesting here?
Emil Verner (EV): Most of my research focuses on the connection between financial markets and the macroeconomy, and especially trying to understand how in some cases financial markets can lead to a build-up of risks resulting in financial crises that bring down the whole economy. In that line of research, one has to think about externalities and issues of coordination problems in behavior. For example, if I take out a mortgage, I don’t necessarily consider that if I default and my home goes into foreclosure, that’s not just bad for me, it’s also bad for my neighbors and the local economy. Early in the pandemic – back in January and February during lockdowns in Wuhan and Italy – I was thinking a lot about how the response to the pandemic also requires thinking about externalities and coordination. For example, during the pandemic, people didn’t necessarily take into account how their actions (a shopping trip or going to work) might have negative spillovers or what economists call “negative externalities” because they might be carriers and infect others. Because of these externalities, more people can become infected than what is even necessary to achieve herd immunity. This is what epidemiologists call “epidemic overshoot.”
An epidemic that spins out of control is going to be very bad for the economy. People aren’t going to want to go to work or go out and spend if they’re afraid of getting sick. The fact that there are these externalities means there’s a potential role for coordination with social distancing policies so we don’t get too many infections at once.
There’s also a practical reason we’re interested in the 1918 pandemic. It’s the closest parallel we have to the coronavirus pandemic. As the coronavirus pandemic was erupting, we started looking into the experience of the U.S. in 1918.
JN: In 1918, the public health responses were from cities rather than states. How did this unfold, and how did this differ from the statewide responses today?
EV: When the second wave arrived in late August of 1918, it started in Boston. Over the course of a few weeks, it spread throughout the Eastern seaboard, down to New Orleans, across to the West Coast, and then inland. The influenza virus spread quickly in about a month. While cities were hearing about the high mortality in Boston and Philadelphia, there wasn’t a coordinated federal response. In fact, the U.S. federal government was mostly focused on fighting World War I and raising financing and producing munitions to fight the war. So cities had to act independently. They responded in different ways. Some responded quickly and aggressively, others more slowly. The differences were due to a variety of reasons, much like today. Some was about information. Cities hit later in the pandemic responded more quickly relative to their outbreaks, because they had heard about how bad things were, for example, in Boston and Philadelphia, and they took action more aggressively. In terms of the responses across cities, most major cities implemented some form of public health intervention. The most common ones were closures of schools, churches, and places of public amusement like theaters, movies, saloons, dance halls, bars, cafes, and hotels. Lots of cities also introduced public gathering bans to prevent what today we would call “super-spreader events.” Examples include the Liberty Loan parades held for financing World War I. Some cities decided to call those off, whereas other cities, because they wanted to meet their Liberty Loan targets didn’t. Those resulted in mass spreads, with Philadelphia being the most famous case. Other policies similar to what we’ve seen today were closures of courts and business hours being staggered, in part to limit the number of people on public transit at any one time. Policies that were applied were for anywhere between one week and ten weeks, with an average of four to five weeks. Comparing to today, these were in place for a relatively short amount of time. Compared to today’s closure of all non-essential businesses, they were less stringent and of shorter duration. The way to think about the comparison is the following: in 1918, in large part, the policies at best served to mitigate the pandemic and prevent “epidemic overshoot.” That is, preventing too many people from getting infected relative to what you would need for herd immunity. Whereas today, the policies have been used in part for mitigation, but also in some places for suppression. Back in March and April, it was a bit unclear what the U.S. was doing. Were we trying to flatten the curve or were we really trying to suppress the virus as other countries like China, New Zealand, and Australia were doing?
JN: It seems politics always enters into both public health and economics. I read that in 1918, the U.S. wanted to follow the Australian quarantine model for returning soldiers, and the blowback was “no, these soldiers have been in Europe – let’s let them go home.” This was a super-spreader kind of policy.
EV: In reading the history, you see the tension. In October 1918, for example, it was between troop movements being suspended, and the U.S. government focused on finishing the war. Public health experts are often not able to get their advice passed through because of other considerations. In Philadelphia, local public health experts warned against the Liberty Loan parade, but again, politics intervened. There was a lot of opposition to these policies, especially from local businesses that worried it was going to hurt their revenues. Politics definitely intervened with public health.
JN: The bottom line of your research is that public health interventions not only led to better health outcomes, but also to better economic outcomes. And yet the discussion in the U.S. is that there is a trade-off between public health outcomes and economic outcomes. How do you interpret your results?
EV: As we were working on this last year, there was a lot of discussion of how “the cure can’t be worse than the disease.” We thought to ourselves, there doesn’t have to be a trade-off, because if you can control the pandemic, that’s going to benefit the economy. We collected data on city-level measures of economic disruptions published by a trade journal that recorded how different cities were doing in 1918 and 1919. We found that in the short run, during the fall of 1918, cities that intervened more aggressively and were able to flatten the mortality curve did not do worse in their economic performance. In the year after the worst of the pandemic, in 1919, you see that cities that intervened more aggressively had higher economic activity relative to before the pandemic than cities that intervened less aggressively. We try to be cautious and interpret this as meaning there’s no clear evidence that there’s a strong trade-off between health and the economy. Our rationalization is that the pandemic itself is very disruptive. Using policies that coordinate behavior and flatten the curve can have benefits for the economy. Even though these policies may directly reduce economic activity, by slowing the spread of the virus, they also mitigate illness and mortality and also fear and panic. To give you a concrete example: Philadelphia, on the spectrum of interventions, was one of the least aggressive, intervened relatively late and saw very high mortality. In the first half of October, over 800 employees at the Bell Telephone Company stayed home from work. Either they were sick or they were afraid of going to work and getting sick. As a result of so many employees staying home, the company took out a full-page ad in the Philadelphia Inquirer asking people to only use the phone for essential calls related to the war or the pandemic. You have lots of examples of businesses being completely disrupted by the illness, the fear, and the panic. Cities that were able to flatten the curve were able to mitigate the severe disruptions that come from such high rates of illness and mortality. I think what you see in 2020 is that the places, the countries, the cities and states in the U.S. that intervened more aggressively and had more stringent social distancing policies and lockdowns didn’t tend to do so much worse economically. Some of them actually even did better economically. I think it’s a similar argument, that the pandemic itself leads to a lot of fear and disruption. So in some sense, implementing policies that slow the spread can mitigate the negative economic consequences of the pandemic itself.
JN: Is what you describe both a demand and supply response? The supply response because workers are afraid to go to work or they are ill, and a demand response because consumers are afraid to go out and buy services?
EV: Exactly. That’s been one of the interesting things in the pandemic. It’s a different type of shock and recession than we’re used to, and it operates on both the demand and supply side. In Sweden, what you’ve seen is that while some people went to bars and restaurants because they weren’t closed, lots of other people became more afraid and decided to stay away. By controlling the virus as Norway and Denmark did more successfully than Sweden, they were able to keep those who were really afraid from reducing their demand as much. There’s some really nice research that compares Denmark and Sweden using individual-level spending data that shows that in Denmark, the more stringent lockdown policies depressed the consumption of young people, who were probably less afraid of the virus (by the time people realized that mortality for young people wasn’t as high). And for older people, you had the opposite. Older people in Sweden reduced their spending, and especially spending that required going into stores and restaurants, because of greater fear. That’s why these policies don’t translate one-for-one into a trade-off, since people respond to the environment they’re in.
JN: Let’s turn to your major field of interest: finance. The Biden Administration put through a $1.9 trillion stimulus package and the Fed is flooding the market with liquidity. These are intended to stabilize the economy. Is this leading to a potential financial crisis? What is your view of these macroeconomic interventions?
EV: I think here there are even more limited historic parallels. Today really is different from all other recessions as it’s very clearly driven by a pandemic. It’s rare that we have a recession where we understand the root source so well as this recession. In 2008 with the financial crisis, we were debating, “Was it the housing market, was it the banks, was it both, was it oil prices?” Here it’s straightforward, but at the same time we don’t have much experience in thinking about this macroenvironment. The way I think of all the stimulus we’ve seen is that it’s less a stimulus and more a relief for people who have lost income because of the pandemic. We know the impacts of the pandemic have been very unequal for different people in different occupations. There’s been lots of inequality in that dimension. I think the stimulus in some ways is a relatively imprecise tool for targeting people who really need the help, but it has provided crucial relief to lots of families. Many have taken that stimulus and saved it leading to very high savings rates. I saw a recent comparison to World War II. World War II also saw very high private savings rates. People’s consumption was suppressed during the war. The estimates of fiscal stimulus tend to be smaller, the effectiveness of fiscal stimulus, the multiplier on public spending that people estimate tends to be smaller. We’re a little bit in a situation like that, where the effects of the stimulus during the pandemic are smaller than they would be during a normal recession because lots of people are just going to save the money, they’re not ready to go out and spend yet. I think once the virus comes much more under control, we’re going to see some of the stimulus generate more of an economic kick, and that will lead to a strong recovery. So then we get into the question of whether the stimulus has actually been too large, and there’s some interesting questions around that. We may end up realizing the stimulus was quite large, especially relative to the output gap. That may lead to some inflationary pressures on the other side. I also think we’re in a position where it’s probably better to be bold and try too much rather than too little.