2023 US-China Annual Economic Report

Cathay Bank | UCLA Anderson Forecast 2023 U.S.-China Annual Economic Report
2023 will be another year full of economic uncertainty for both the U.S. and China. After a series of aggressive interest rate hikes by the Fed, from 0% to 4.6% over the past 12 months, we are seeing slowing inflation rates as well as negative economic consequences. The rapid collapse of Silicon Valley Bank (SVB) on March 10, 2023, sent a shock wave through the financial world. After a bank run of $42 billion, U.S. federal regulators took control of SVB, the 16th largest bank with $195 billion of assets. To prevent a spreading panic in the banking system, U.S. regulators announced emergency measures that guaranteed all deposits of SVB, and by implication, all other banks. Signature Bank, the 29th largest bank, also went into receivership. The open question is: Will the Federal Reserve continue raising the interest rates aggressively to fight against inflation? Or will the Fed pause or even cut rates to calm a jittery banking system? At this critical moment, it is extremely challenging for monetary policy to achieve all of its three main objectives: price stability, financial stability, and low unemployment.
Across the ocean, China’s economy is also facing a myriad of difficulties. After months of strict Zero-Covid policies that caused severe disruptions in social lives and business activity in 2022, China reopened. With the fallout from past Covid policies and troubling real estate markets, local governments across the country are now facing serious fiscal deficits.
With domestic concerns occupying both Washington and Beijing, distrust between them has risen. The extent to which relations have deteriorated is evidenced by U.S. Secretary of State Blinken’s planned February visit to China. Just before the visit was to take place, a Chinese-originated balloon flew across the U.S. and derailed the meeting. How will deteriorating U.S./China political relations impact the economic relations between these two economies? In this report, we provide some insight into this question in the context of the U.S. and Chinese economies and the global supply chains that link them.
The U.S. Economy and Outlook
The pandemic-induced expansionary monetary policies and fiscal stimulus led to a significant increase in money in the banking system. Figure 1 shows the total reserves in the Fed (the monetary base). It increased by $4.8 trillion between February 2020 and April 2021. M2 increased by $6.5 trillion from February 2020 to April 2022. This unprecedented influx of liquidity brought with it both demand-induced inflation (Figure 2), and an environment in which rising interest rates from Fed policy had the potential to create imbalances in financial markets (Figure 3).
Figure 1. U.S. Money Supply (M2) and Total Reserves at the Fed
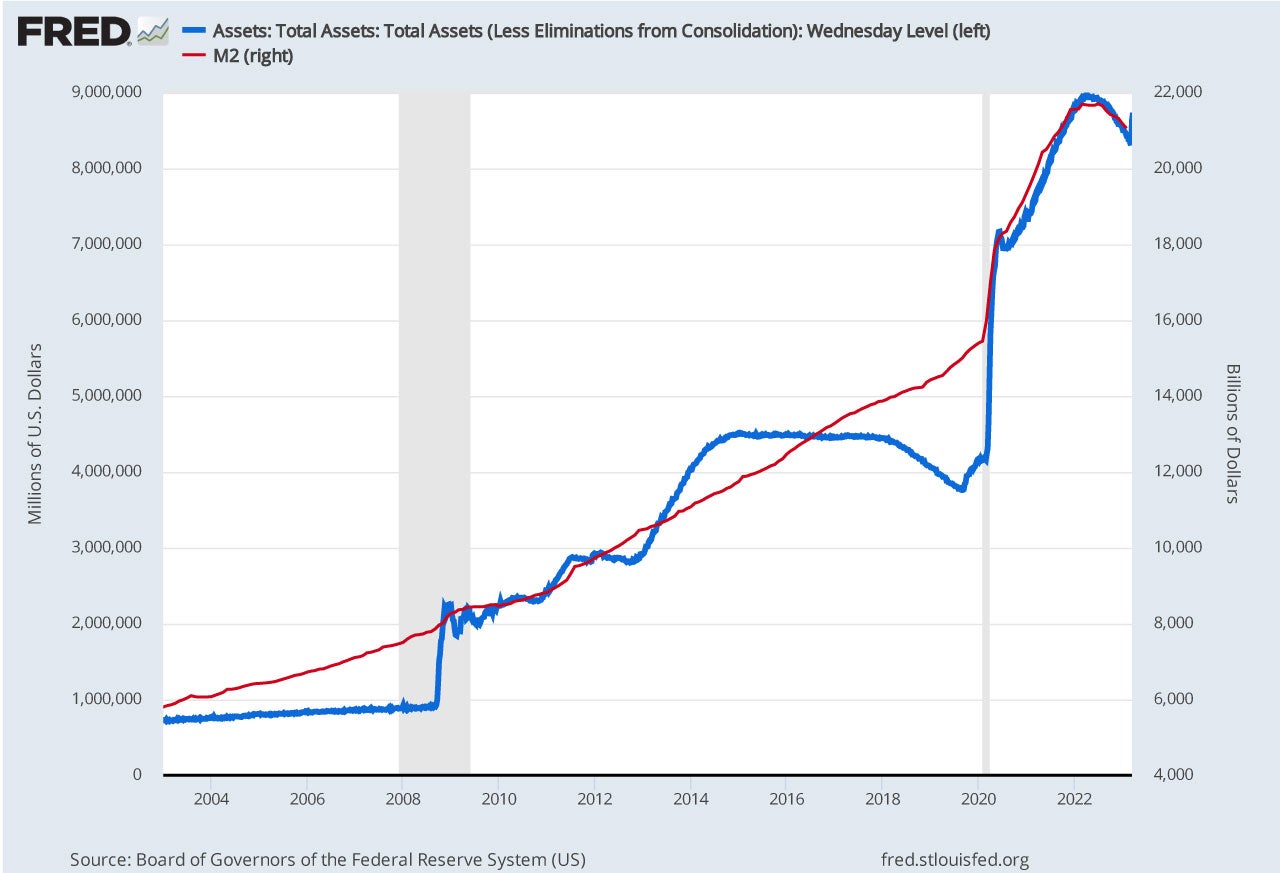
Figure 2. Year-over-year Price Inflation Rates in the U.S.
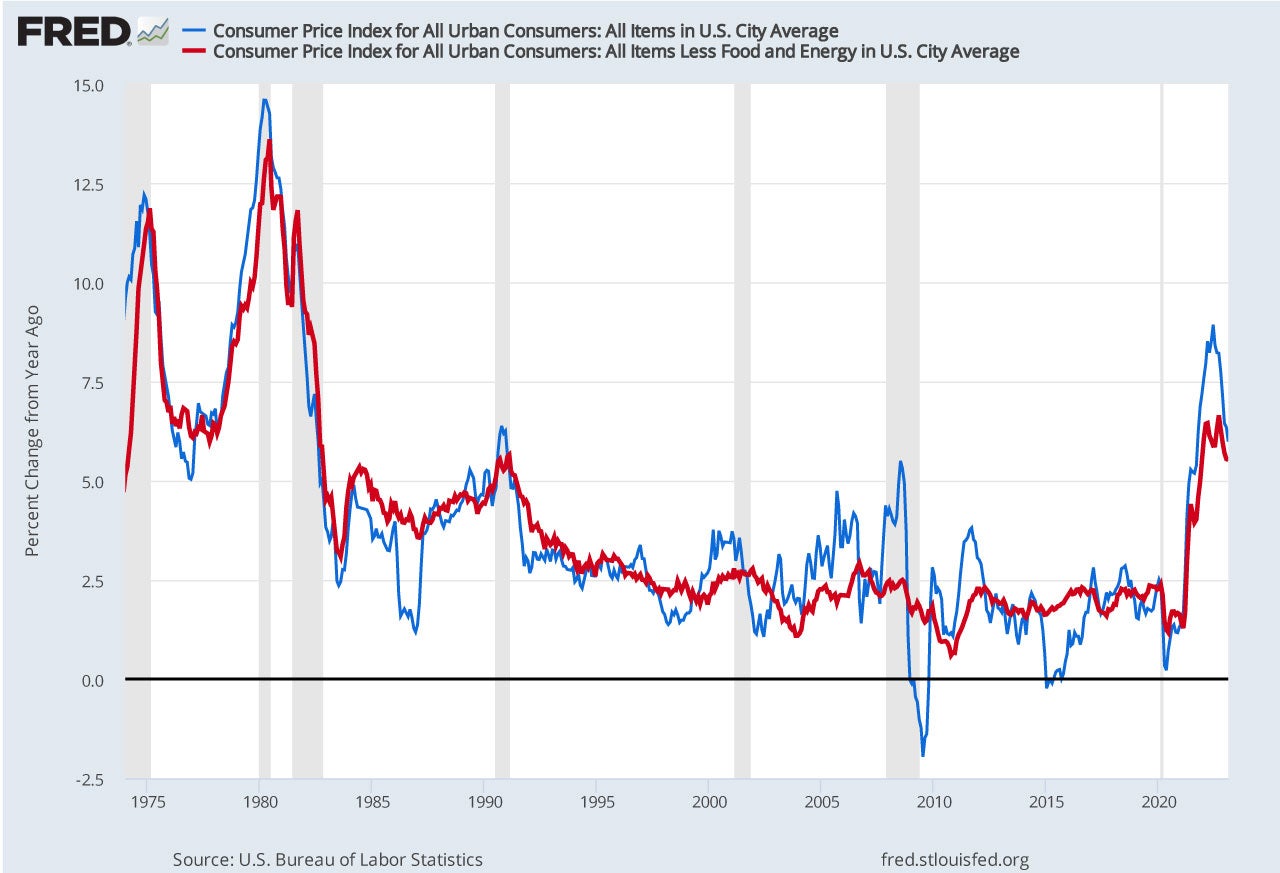
Figure 3. The Federal Funds Effective Rates
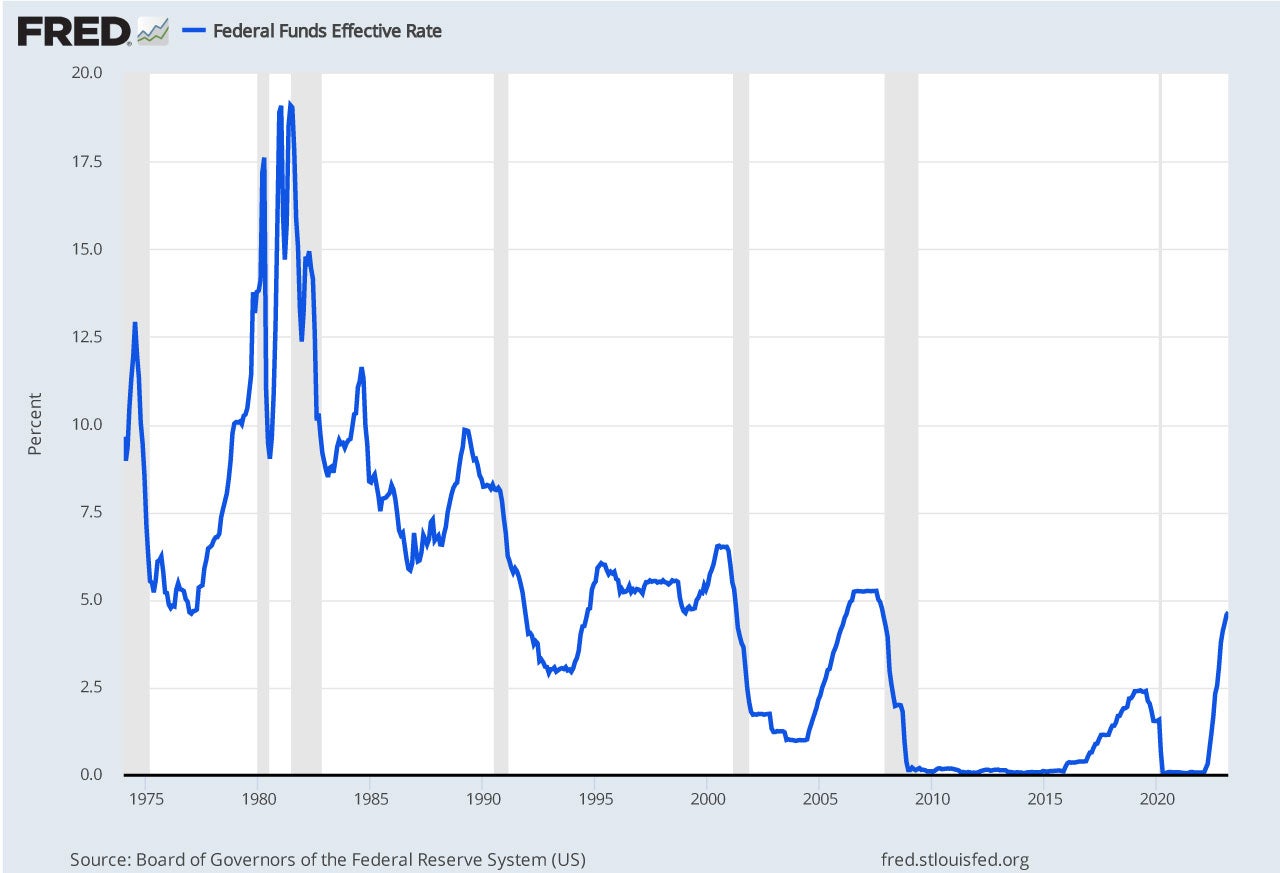
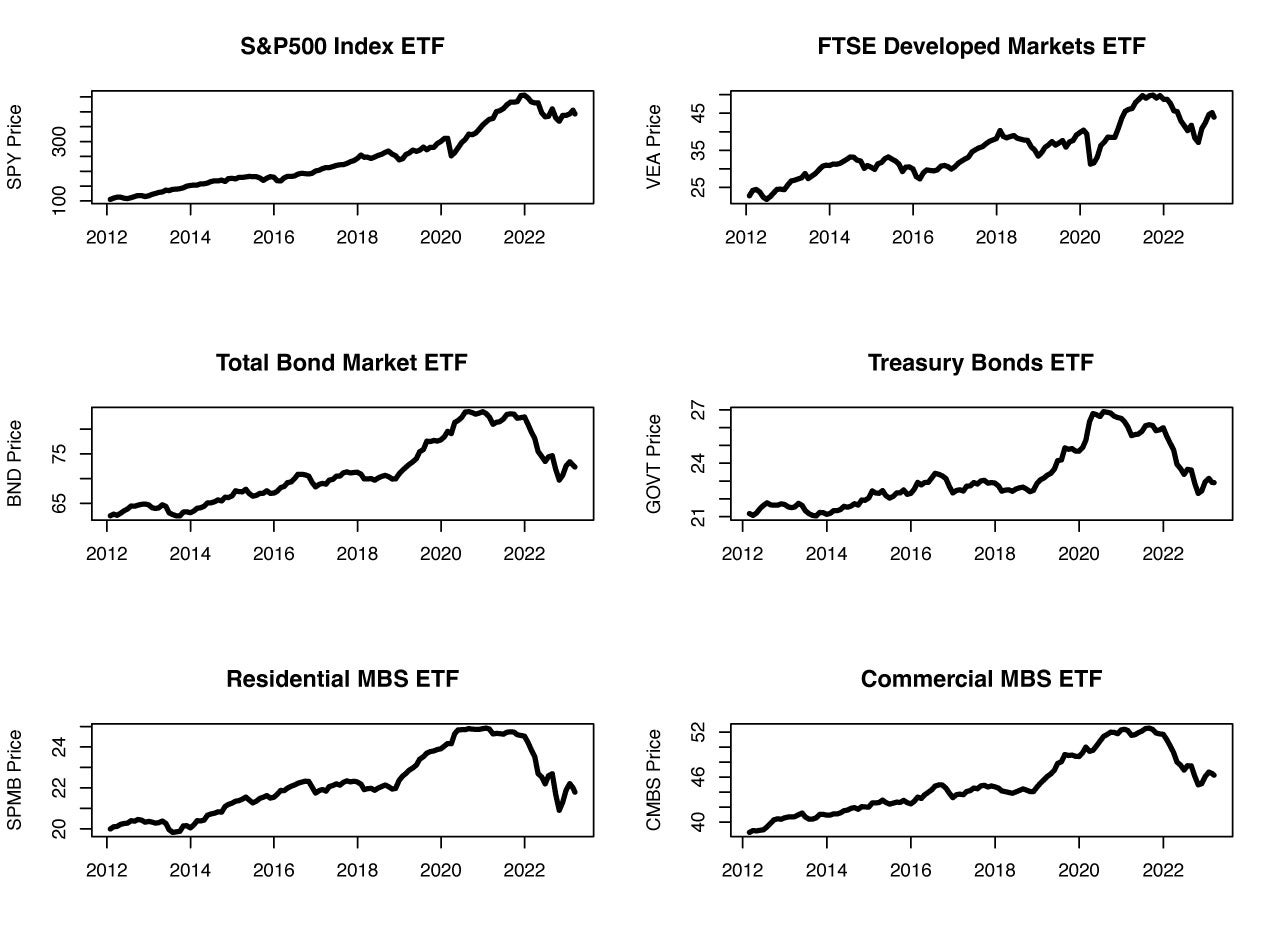
Figure 4 displays the prices of exchange-traded funds (ETF) for the U.S. (S&P 500) and for international stocks (FTSE developed markets for Asia and Europe), the total bond market, the Treasury bond market, residential and commercial mortgage-backed securities (MBS) since 2012. We can see that bond and MBS ETFs with interest rate risk suffered a larger loss than stock ETFs in the rising rate environment. For example, from January 2021 to March 15, 2023, U.S. stock prices gained 8%, and international developed market stock prices lost 3%, while riskier bond and MBS assets lost 13% of their values. This uncertainty in financial markets feeds directly into uncertainty with respect to the real economy as policy in Washington vis-à-vis stress in financial and real sectors remains unknown.
Figure 4. Prices of Selected Exchange-Traded Fund (ETF)
As a consequence of this uncertainty, we offer two forecast scenarios for the U.S. economy: (1) Recession and (2) No Recession1 distinguished by differences in monetary policy trajectories. If the Fed decides that inflation is the biggest problem in the economy and continues raising the Federal Funds rate aggressively to combat that inflation, then we predict a recession will occur beginning in Q3 2023. In this scenario, housing markets and commercial real estate activity will be weak; durable goods consumption will decline; business investment will be reduced; and unemployment will rise. Nevertheless, the forecast is for such a recession to be a mild one given no significant over-investment in housing markets occurred over the past decade and there were no other significant imbalances in the economy going into 2023.
On the other hand, if the Fed decides that financial stability and maximum employment are more important goals, they will stop raising rates and might even start cutting rates, and they will stop quantitative tightening. In this scenario, confidence in financial stability will be restored; financial losses will be moderated; housing market activity will begin to recover; and though inflation will be at a higher level, there will not be a recession in 2023.
The Chinese Economy
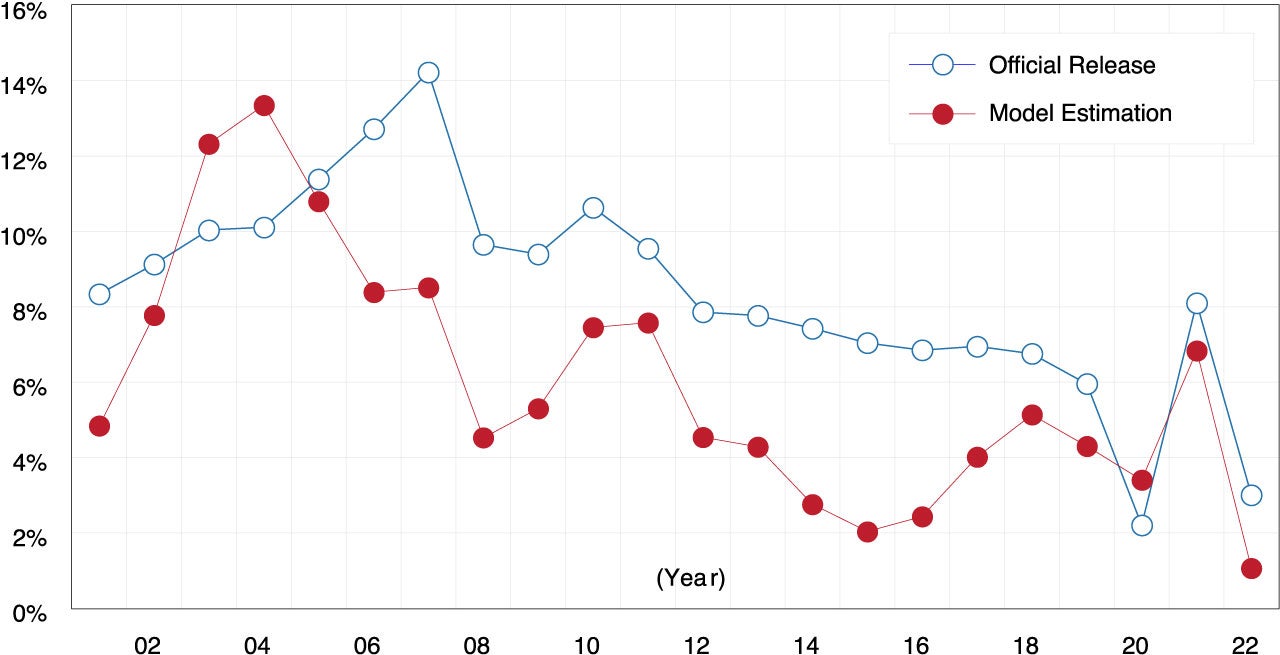
China’s GDP grew by 3% in 2022, according to its National Bureau of Statistics (NBS). Given many disruptions due to Covid outbreaks and restrictive Covid policies across the country, this growth rate is again higher than many forecasters’ predictions. The UCLA Anderson Forecast developed an alternative model to estimate China’s GDP growth.2 The model uses four key variables’ annual growth rates and their values in 2022 were as follows: annual growth rates, of energy consumption: 0%, CO2 emissions: -1.5%, total trade (exports plus imports): 7.7%, and home price growth: -5.1%. Using the Forecast’s model, China’s GDP growth rate in 2022 is estimated to be 1.1%, lower than the official Chinese estimate. Figure 5 shows our model estimation of historical China GDP (red line) vs. the NBS’ official numbers (blue line). We can see our estimates exhibit lower growth rates on average than the official numbers, and they are more volatile. For both, Chinese GDP growth rates exhibit a slowing or downward trend over time.
Figure 5. China's GDP Growth Rate (Official and Forecast Model Estimates)
In recent years, China has moved towards central planning policy to control business and economic activity. For example, Beijing has been taking an aggressive approach to managing and regulating tech and real estate companies, has asked the rich to return more to society to achieve “common prosperity,” and has insisted on strict Covid policies. In recent months, however, Chinese leaders reversed course and expressed that there will be a new business-friendly attitude to the private sector. What changed? We suggest that the reality is closer to our GDP estimates than the official ones. This realization is based on observation of property markets in crisis; financial risk for developers and lending institutions rising; the economy slowing; stress in job markets for younger college-educated Chinese; fiscal stress at the local government level; and foreign companies leaving. To turn at least some of these around, China has begun to embrace private business anew. Nevertheless, there is uncertainty with regard to how much the Chinese government will change policy and how Chinese businesses will react to that change.
Reshaping Global Supply Chains
Because of existing tariffs, rising tensions between the U.S. and China, and the fragility of supply chains demonstrated during the pandemic, global supply chains are reshaping. To change any individual supply chain is costly, and therefore, it is happening gradually.
For all of the talk about deglobalization, and it is happening, the evidence has yet to be seen in the data. Figure 6 shows U.S. real goods imports from the rest of the world since 1995. The total real import values have increased with the expanding U.S. economy, with the exception of the three recessions: 2001, 2008, and 2020. In the five categories of imports, only industrial supplies, e.g. petroleum, do not show an upward-sloping trend. The latter reflects the development of the U.S. domestic petroleum extraction sector, now the largest in the world.
Figure 6. U.S. Real Goods Imports, 1995 to 2022
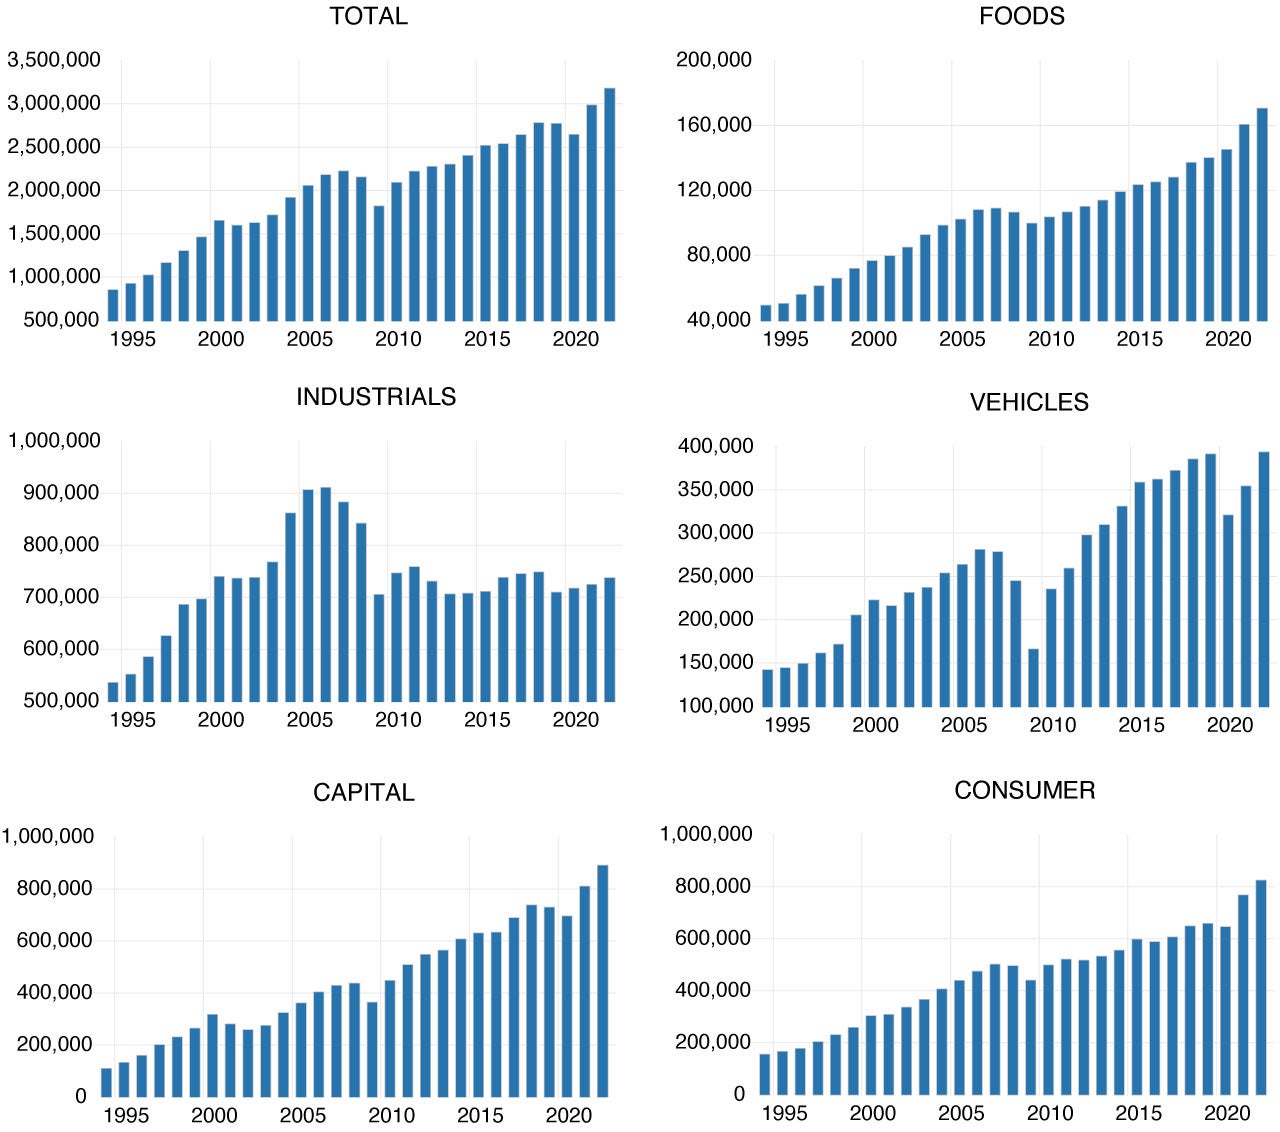
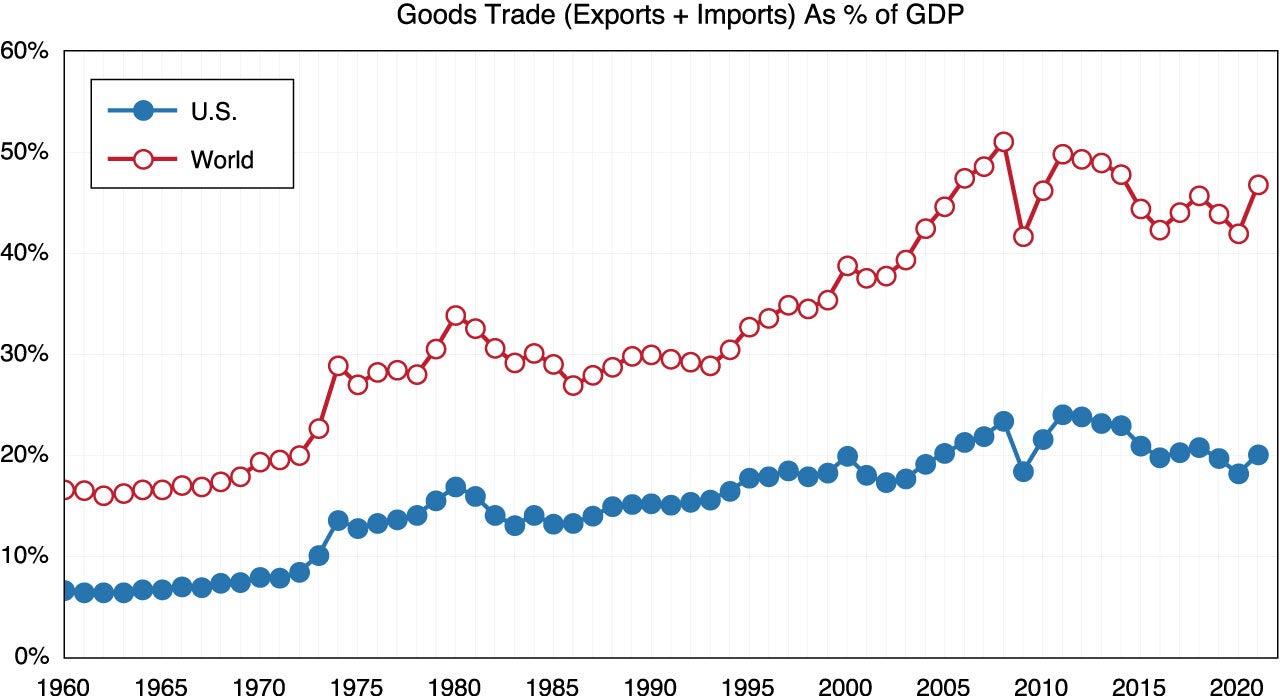
Figure 7 shows the goods trade, both export and import values combined, as a percentage of GDP in the world and the U.S. We do see international trade as a share of the economy peaked around the global financial crisis in 2008. The share has fluctuated around 45% for the world’s GDP and 20% for the U.S. There is no indication of a downward sloping trend. Therefore, deglobalization has to this point, been reflected in changed countries of origin rather than true deglobalization through onshoring of business.
Figure 7. International Trade Values as Share of GDP in the World and the U.S., 1960 to 2021
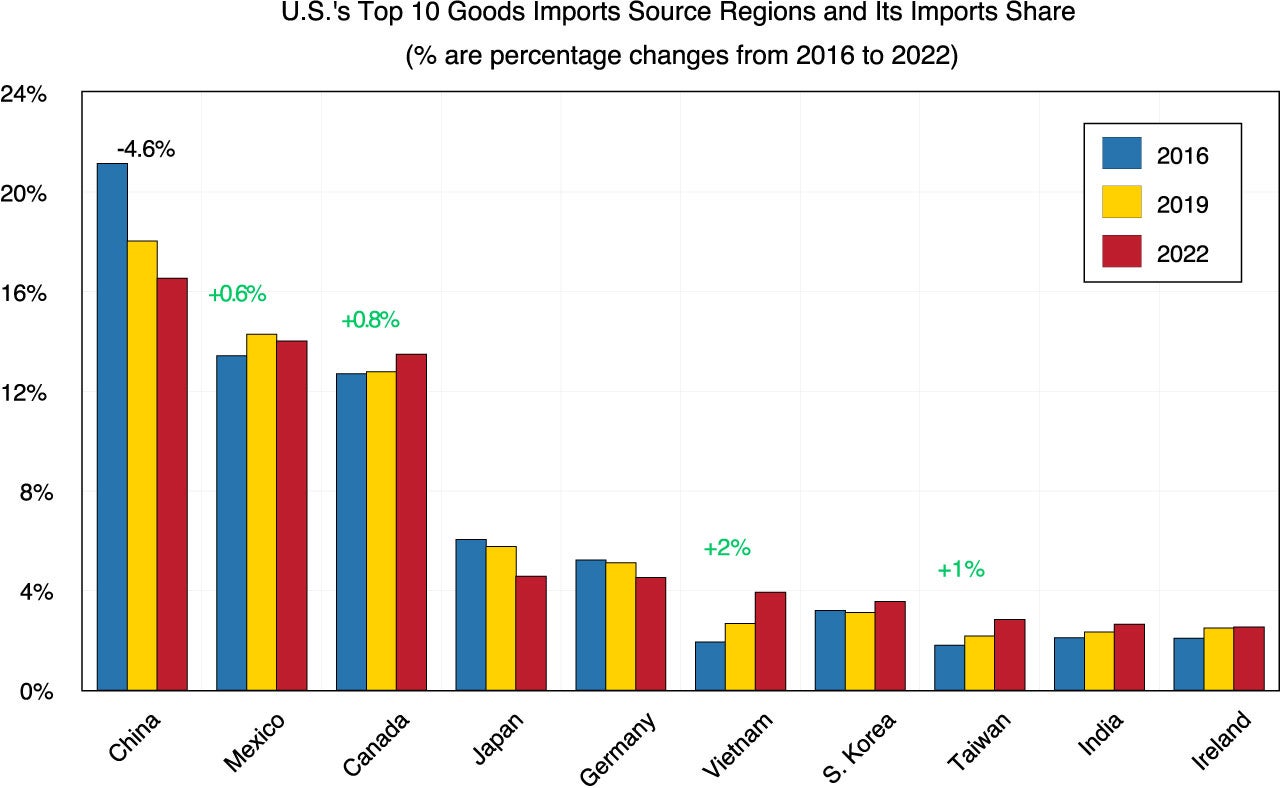
The share of U.S. imports from China has been exhibiting a slowly declining trend. Figure 8 shows the U.S.’s top ten source regions for goods imports and imports share in 2016 (pre-trade war era, blue bar), 2019 (one year after the trade war and one year before the pandemic, yellow bar), and 2022 (two years after the global pandemic, red bar). While China is still the largest trading partner for imports, its importance has reduced since the trade war began in 2018. From 2016 to 2022, the U.S. import share for China declined by 4.6%. U.S. goods imports from Mexico have increased slightly by 0.6%, and from Canada increased by 0.8%. U.S. imports from Vietnam, South Korea, Taiwan, India, and Ireland have increased as well. The two trading partners with the largest import share increases are Vietnam (by 2%) and Taiwan (by 1%).
Figure 8. U.S.'s Top Ten Source Regions for Goods Imports, 2016, 2019, and 2022
Note that while U.S. goods imports from China have declined, U.S. imports from the rest of Asia have increased significantly (Figure 9). That said, there is a force reshaping and diversifying away from China to other Southeast Asia countries. Asia remains important for U.S. goods imports. This is evidence of friend-shoring, given rising adversaries, tensions, and distrust between the U.S. and China over the past few years. Meanwhile, U.S. imports from North America have slowly increased. This could be evidence of near-shoring adjustment in response to the fragility of distant global supply chains, but it is too early to tell.
Figure 9. U.S.'s Goods Imports Share from Regions Excluding CHina, 2016, 2019, 2022
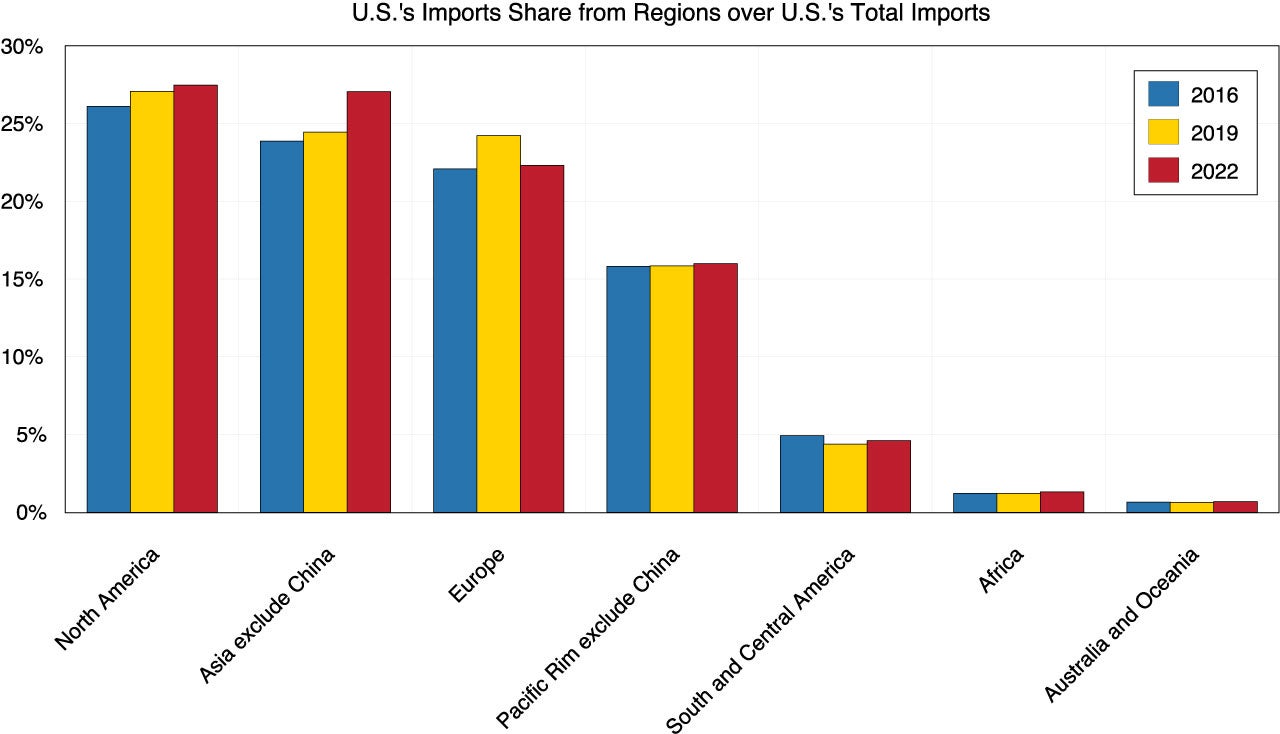
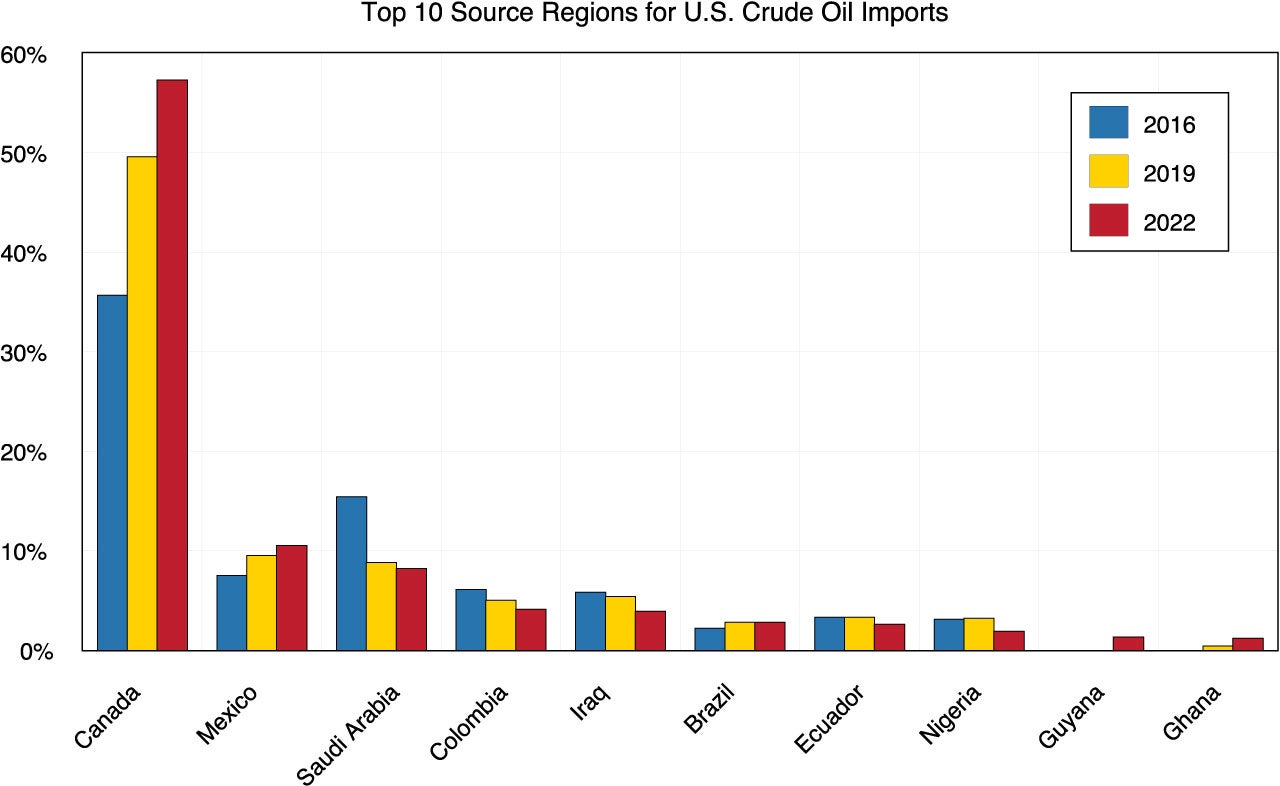
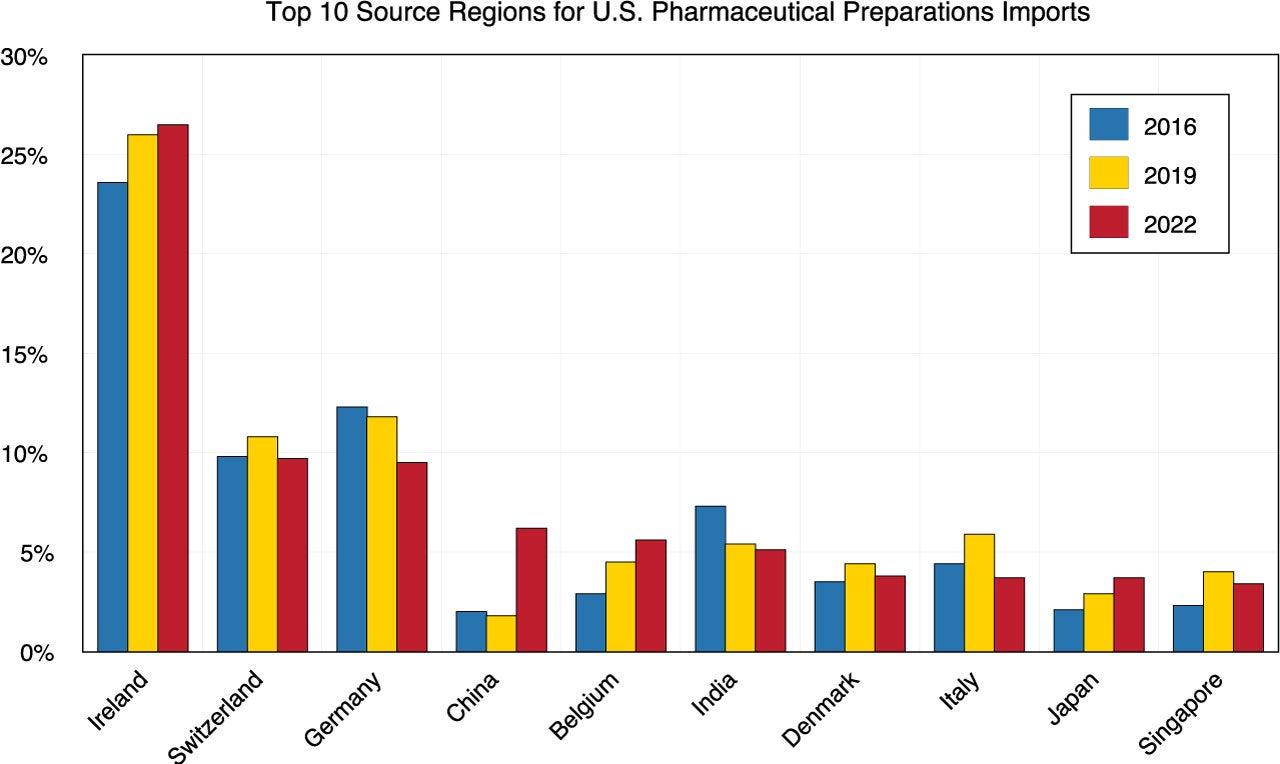
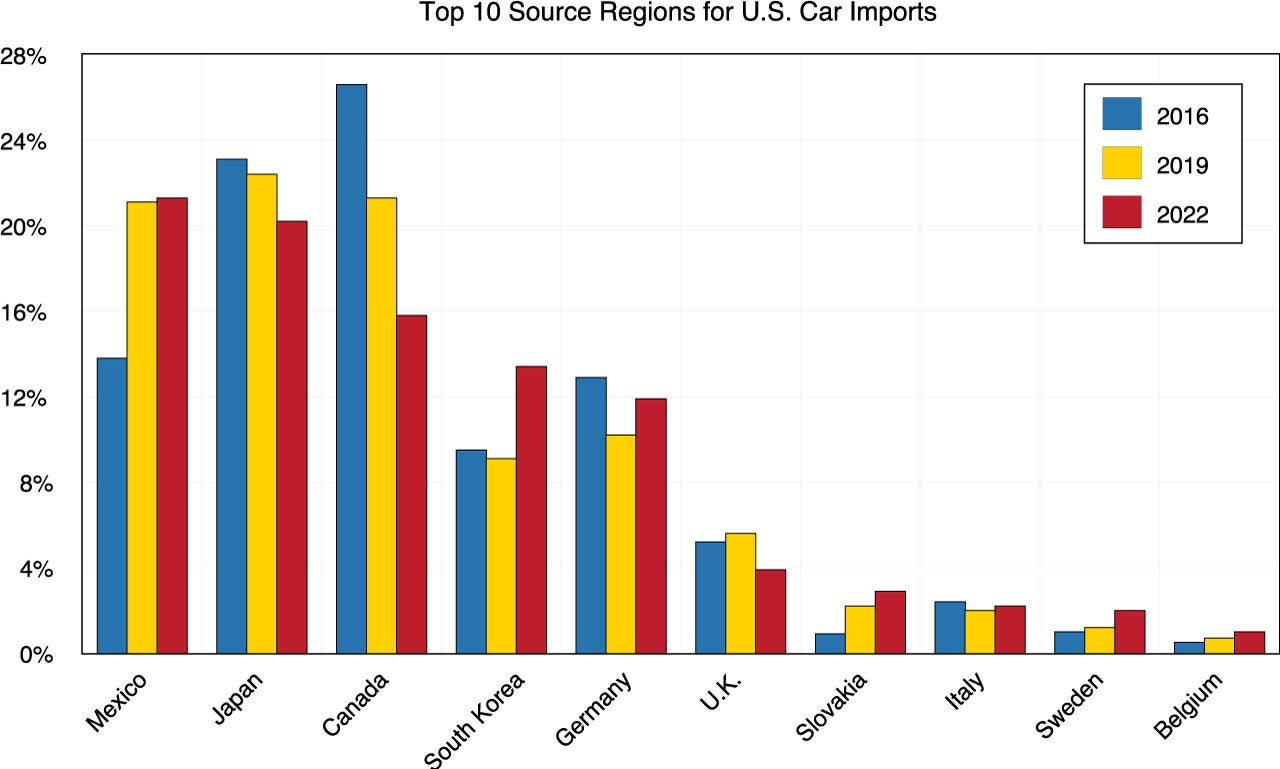
Figure 10 shows the U.S. top 20 imported products in 2016, 2019, and 2022. We can see in 2016, the number one imported good was passenger cars. In 2022, it dropped significantly to number three. There are two reasons for it. First, there was a serious shortage of chips during the pandemic, so global auto production was curtailed. Second, the U.S. has had an increase in domestic production of motor vehicles, yielding less dependence on car imports. Meanwhile, U.S. imports of crude oil increased due to the pandemic shutdown of production and the inability to return to previous production levels in response to a rapid increase in demand. With recent increases in domestic production, this trend is expected to reverse. U.S. imports of pharmaceutical preparations, i.e. active pharmaceutical ingredients (APIs), have increased sharply due to the manufacturing of Covid vaccines.
Figure 10. Top 20 Imported Goods inthe U.S., 2016, 2019, 2022
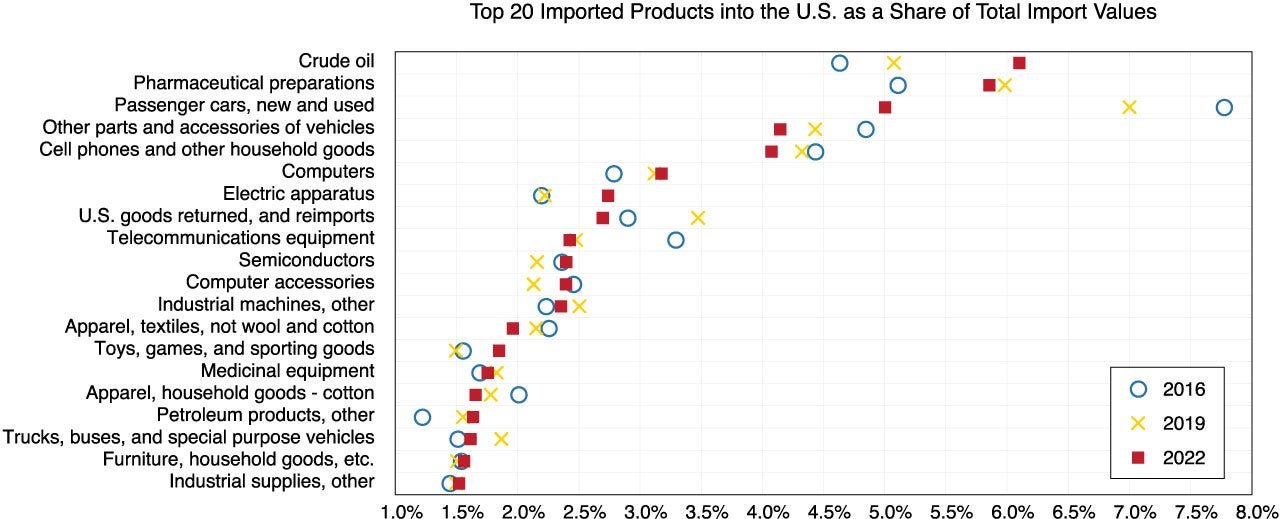
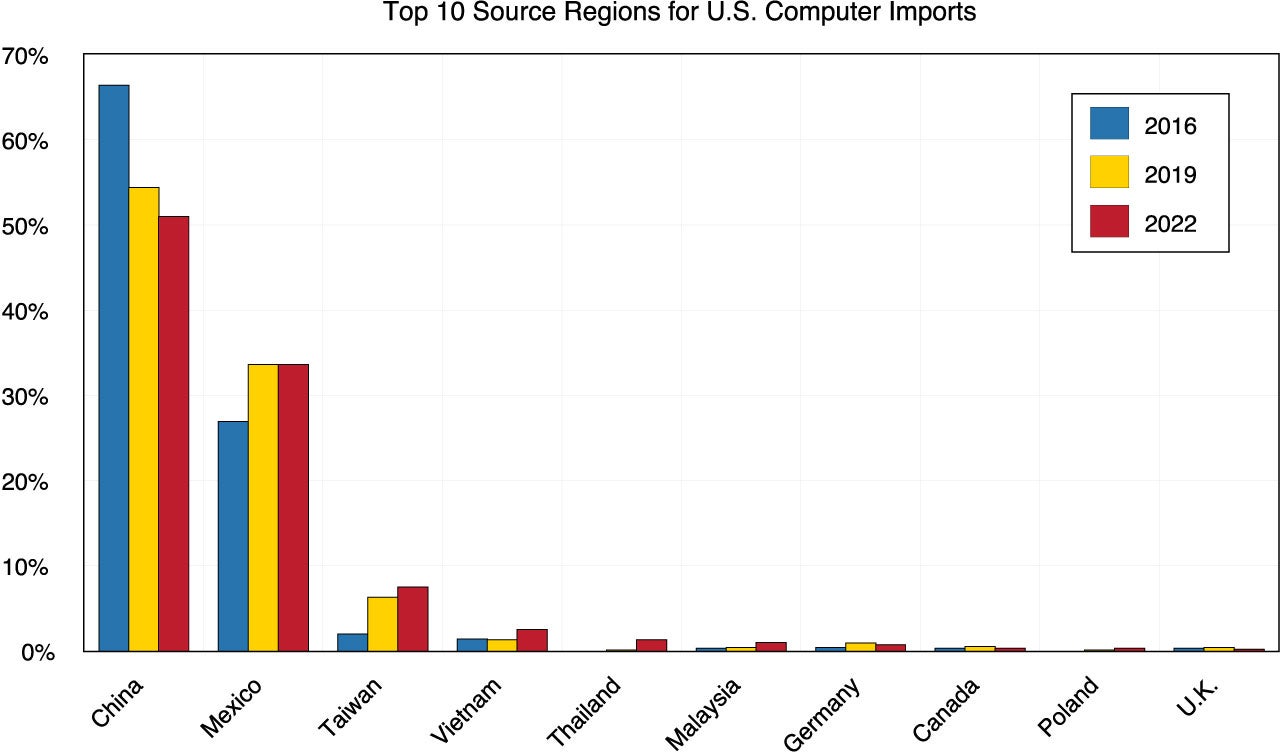
Figure 11 shows the U.S. top 20 imported products from China in 2016, 2019, and 2022. The top four products in 2022 are (1) cell phones, (2) computers, (3) toys and sporting goods, and (4) apparel. Note that U.S. import shares for the top two goods have declined. More importantly, in 2016, the number three imported products from China were computer accessories. However, its share dropped significantly to number six in 2022. Number four was telecommunications equipment in 2016. In 2022, it dropped substantially to the number 9 position. We suggest that the dramatic declines of these two technology products from China are related to rising concerns of information security and national security.
Figure 11. Top 20 Imported Goods from China into the U.S., 2016, 2019, 2022
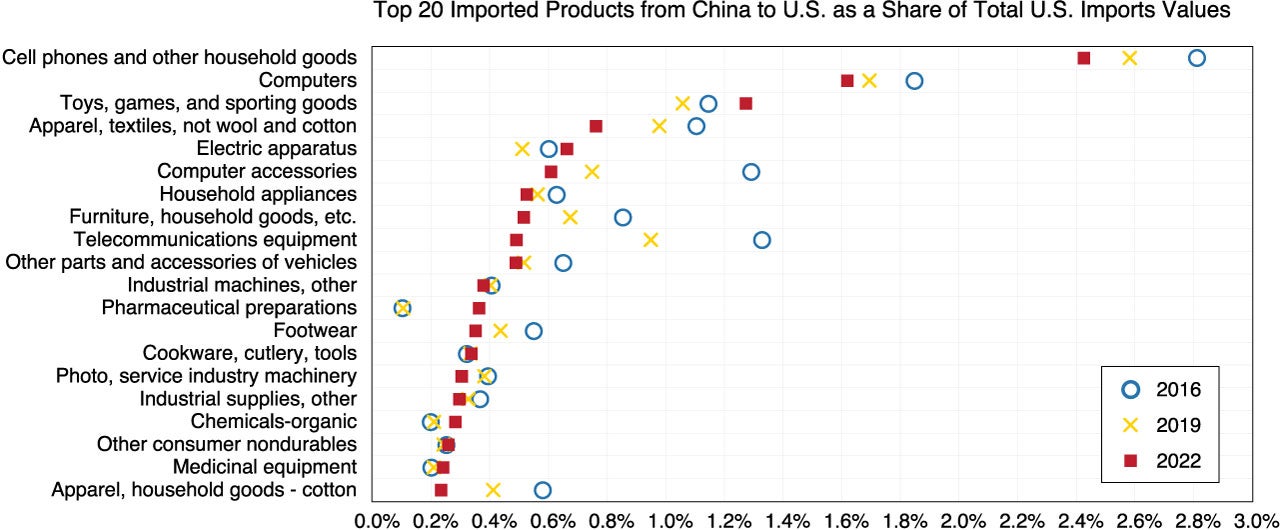
Figure 12 shows the top 10 regions for U.S. computer accessories imports in 2016, 2019, and 2022. We can see the imports from China declined rapidly over the period from 53% of total computer accessories in 2016 to 25% in 2022. Meanwhile, U.S. imports from Taiwan, South Korea, and Vietnam increased rapidly, with these friendlier sources for these goods allaying national security concerns. Similarly, Figure 13 shows the top 10 regions for U.S. telecommunications equipment imports in 2016, 2019, and 2022. U.S. imports of these goods from China decreased from 40% in 2016 to 20% in 2022.
Figure 12. Top Top 10 Regions for U.S. Computer Accessories Imports, 2016, 2019, 2022
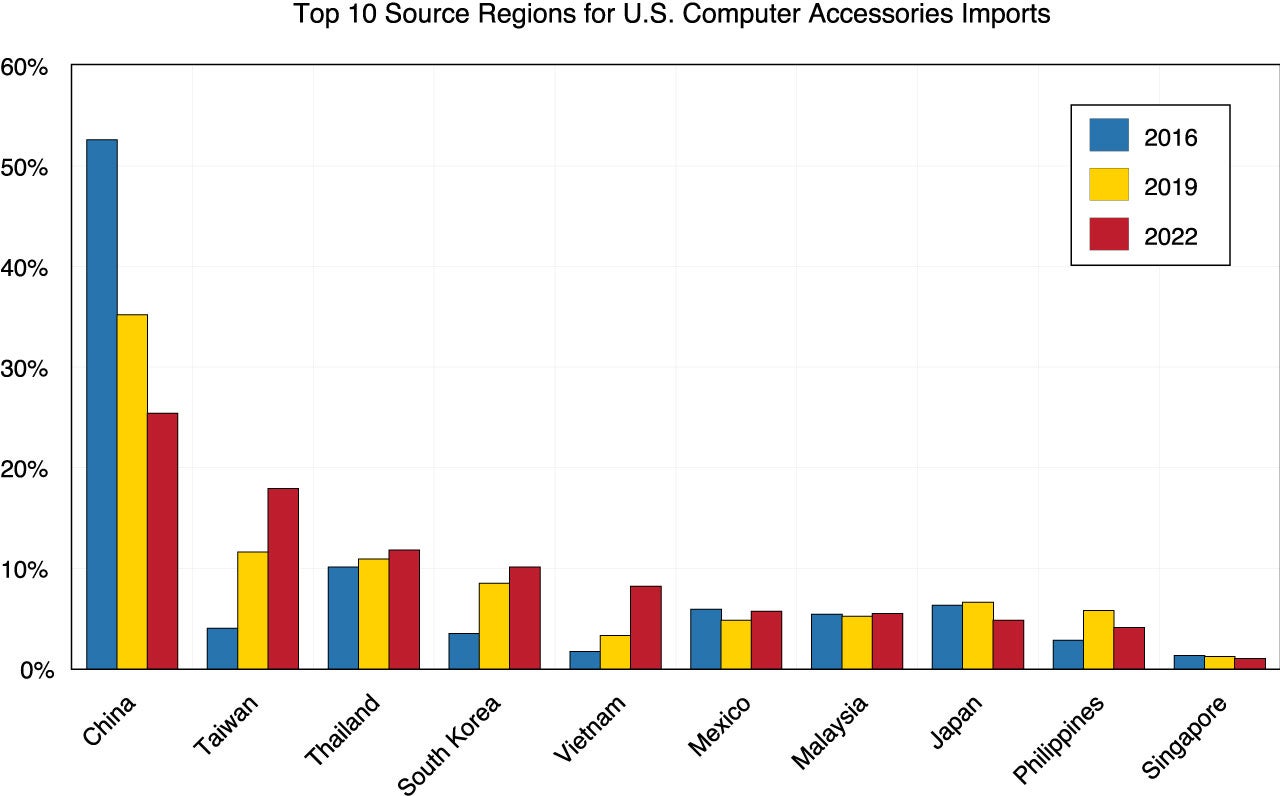
Figure 13. Top 10 Regions of U.S. Telecommunications Equipment Imports, 2016, 2019, 2022
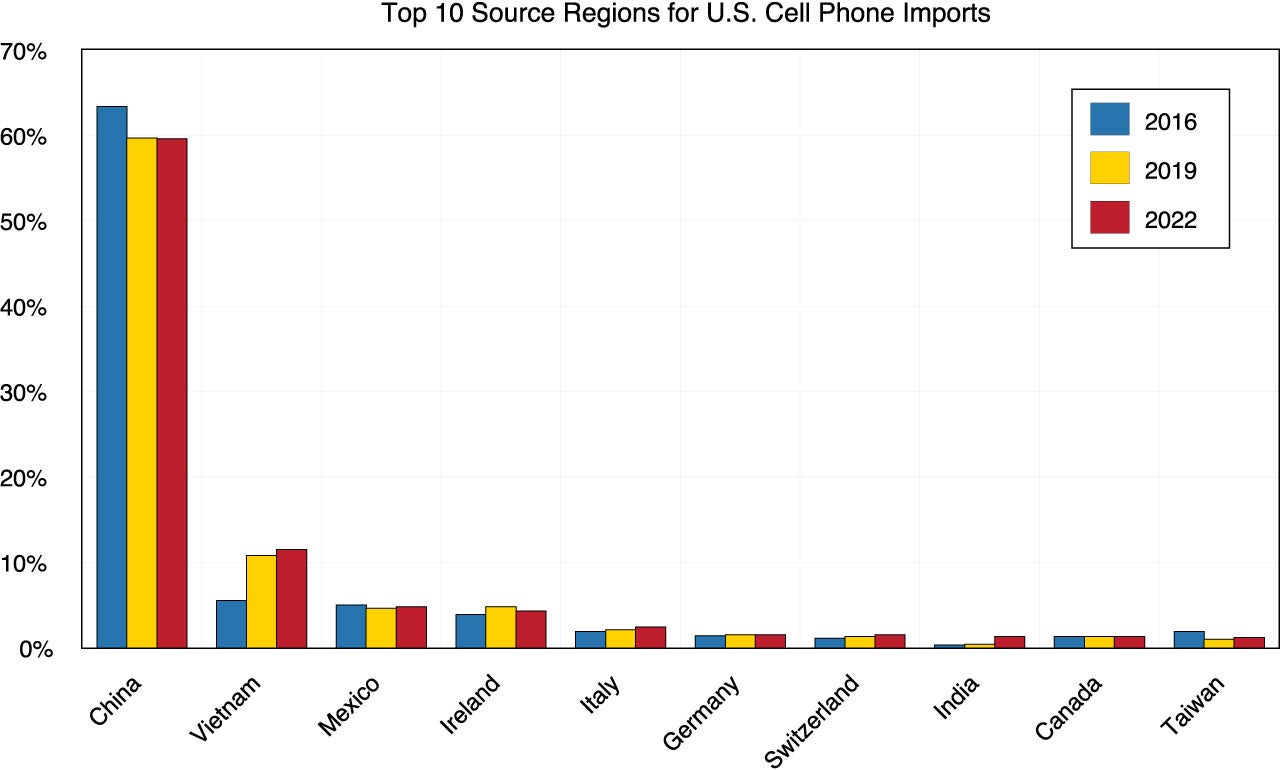
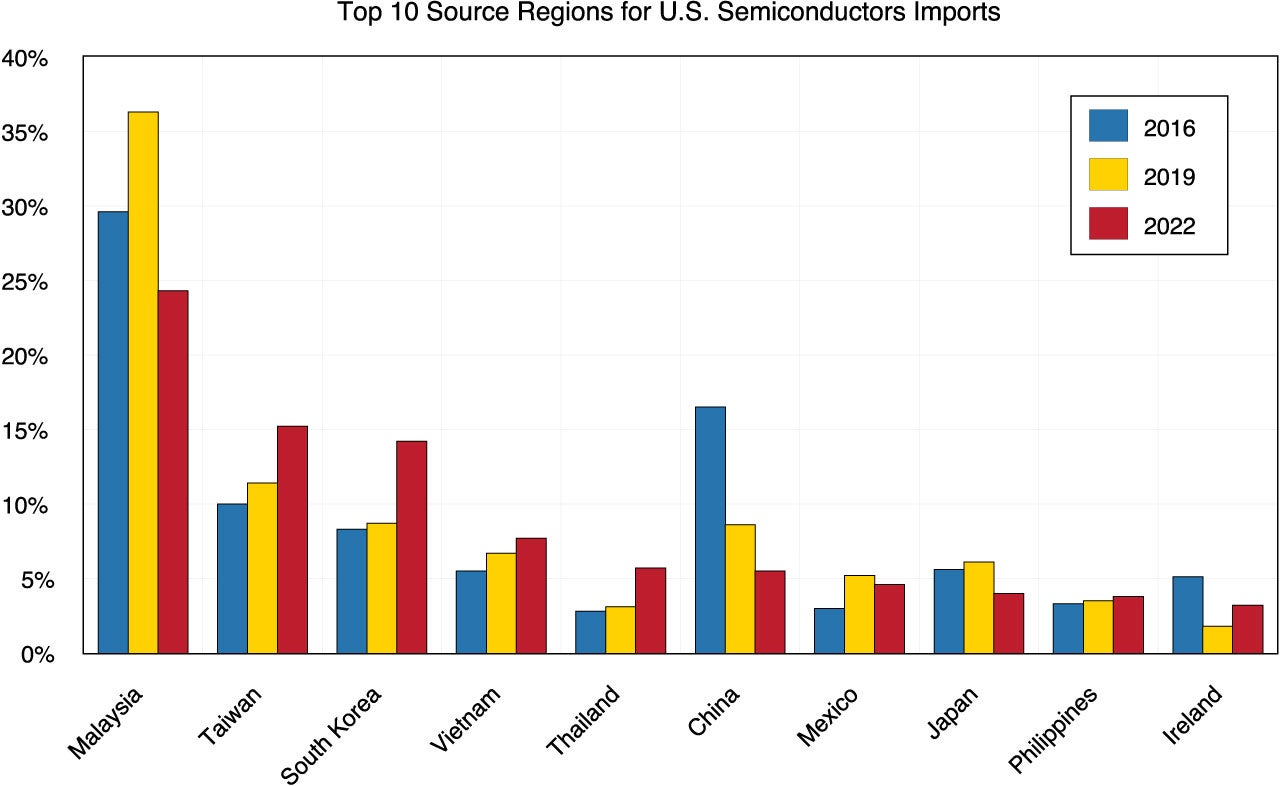
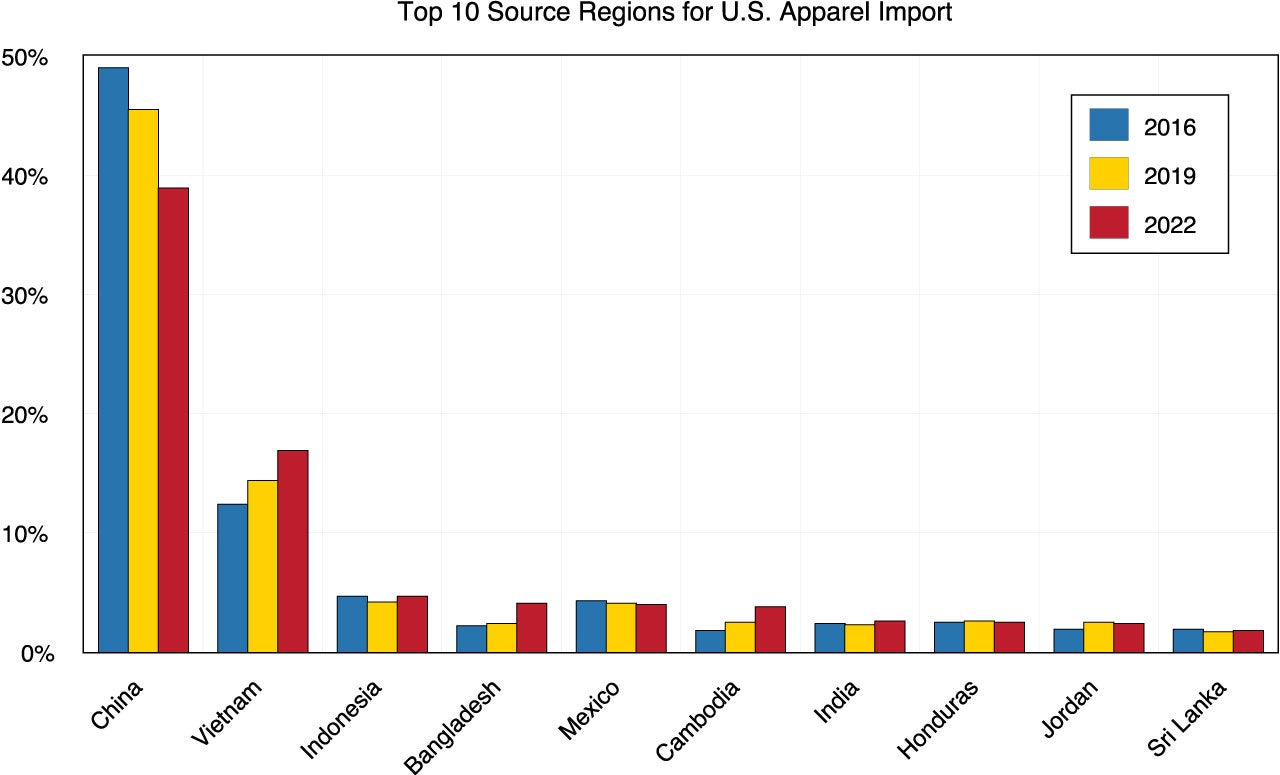
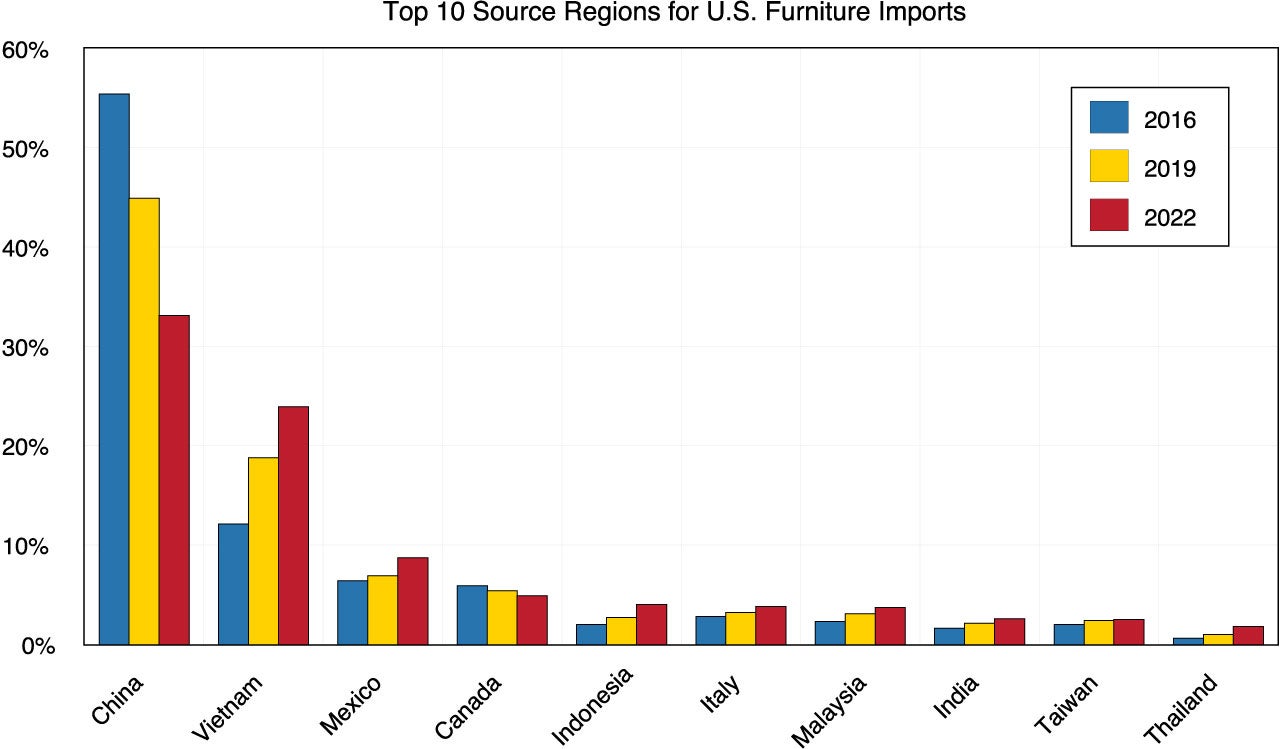
Appendix A shows the top 10 regions for other major U.S. imported goods in 2016, 2019, and 2022. We can see U.S. semiconductor imports from China also decreased sharply from 17% (ranked number 2) of total semiconductor imports in 2016 to 5% (ranked number 6) in 2022. For apparel and furniture goods, import shares from China declined mostly due to rising production costs in China. While imports of cell phones, including the popular iPhone, still disproportionally rely on China and only declined from 64% in 2016 to 60% in 2022, we expect dependence on China for cell phone production will decline in the future as well. One indication of this comes from Foxconn, one of Apple’s largest manufacturers, announcing that it will invest $700 million to build a new plant for iPhones in India.
Conclusion
In the first year of the post-pandemic era, 2023, both the U.S. and China faced economic difficulties and challenges. The U.S. is facing the most serious banking crisis since 2008. Federal regulators are using measures to restore the confidence of depositors and investors. The Fed is at a decision point: less aggressive monetary tightening policies or easing monetary policies. We won’t know which will be the actual policy for several months. However, it is less likely that there will be a drop in interest rates as U.S. inflation remains high. China is facing a significant problem with deflating real estate values, high debt accumulation by its banks, and an exodus of some foreign businesses and manufacturers. Though we forecast slow economic growth for China over the next few years, Beijing is also at a decision point; continue with the shared prosperity relying on state-owned enterprises codified at the 20th Congress, or pivot to a reliance on private enterprise to shore up economic growth. It will also be some months before this uncertainty is resolved.
The U.S. and China, two great powers and the largest world economies, continue to be in strategic competition. The U.S. House formed a new select committee on strategic competition between the U.S. and the Chinese Communist Party in January 2023. It held its first hearing in February. Chairman Gallagher said in the hearing that the strategic competition between the U.S. and China is an existential struggle over what life will look like in the 21st century. Looking forward, we predict the U.S./China economic relationship of 2023 will be full of uncertainties, if not with more confrontation and restrictions. Additionally, the decoupling of the past few years will continue and, depending on how geopolitical policy plays out, perhaps accelerate.
Appendix