
2026-us-china-fall-economic-update

Cathay Bank | UCLA Anderson Forecast 2026 U.S.-China Fall Economic Update
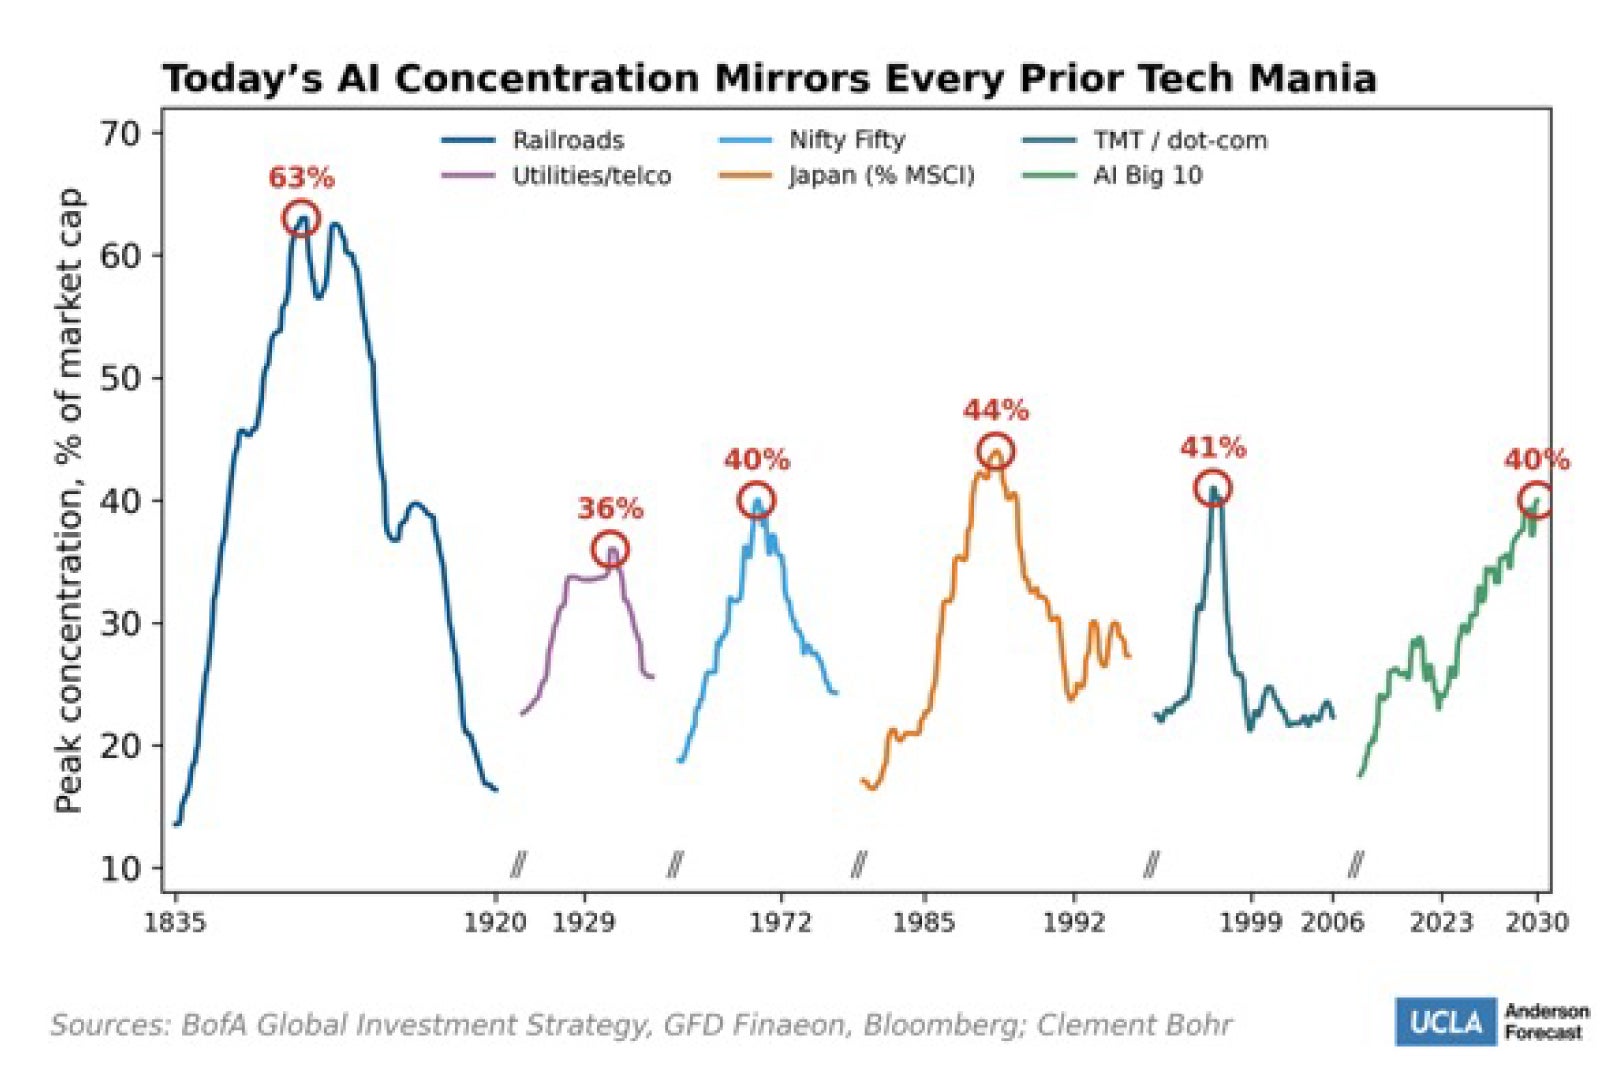
Artificial intelligence has not overtaken every corner of the economy, but it dominates the current economic conversation as though it has. While not unprecedented, it is rare for a single technology to capture the country’s zeitgeist so completely. Stock market concentration offers one measure of just how pervasive the AI narrative is. The ten most AI-exposed companies now account for around 40 percent of total U.S. stock market value, according to Bank of America Global Investment Strategy, a share that rivals the peaks reached by the Nifty Fifty in 1972, Japan’s bubble-era conglomerates in 1989, and the dot-com bubble of 1999 (Figure 1a).
Figure 1a. Today's AI Concentration Mirrors Every Prior Tech Mania
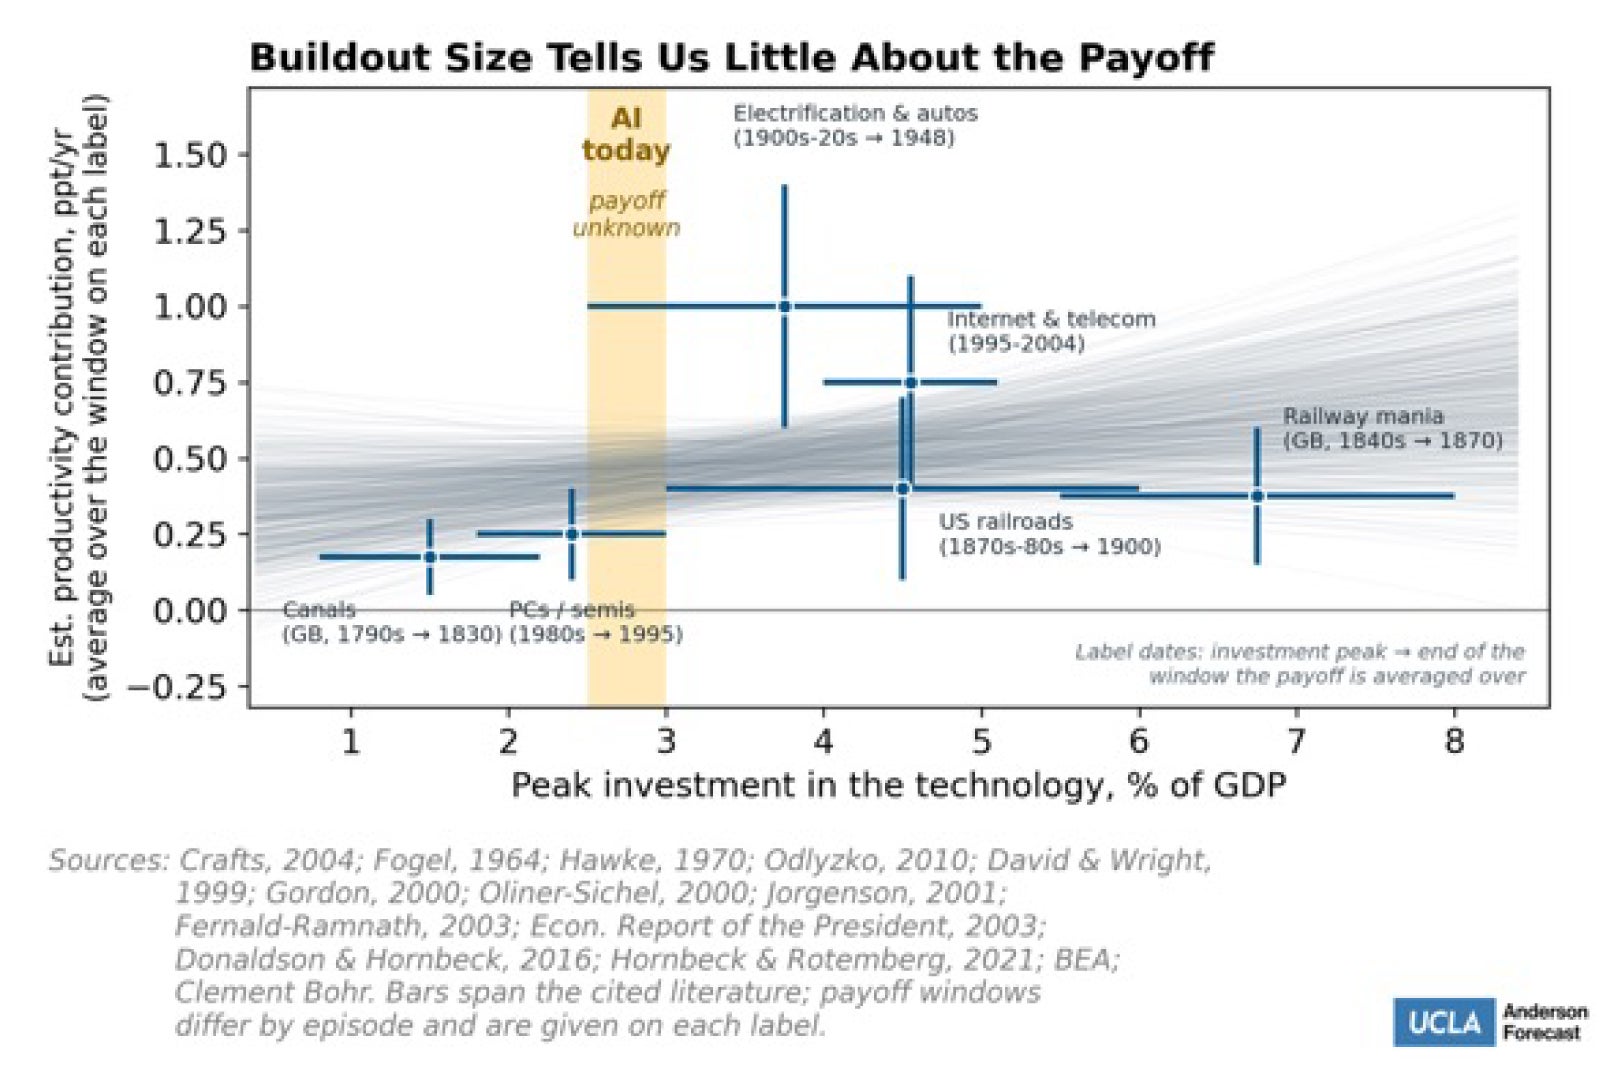
Unfortunately, a bigger investment boom doesn’t always signal a bigger breakthrough. Plotting peak investment as a share of GDP against each technology’s estimated long-run contribution to productivity growth across six historical episodes produces a relationship that is only faintly positive (Figure 1b).1] However, we would caution against drawing any strong conclusions from six episodes, each measured with wide errors.
Figure 1b. Buildout Size Tells Us Little About the Payoff
While boom size has been a weak guide to the growth that follows it, larger booms do tend to fund more of the underlying infrastructure that the technology eventually requires. A study from the Bank for International Settlements characterizes the technology buildout as a contest among a handful of firms racing for a small number of dominant positions. This is the same competitive dynamic that pushed prior technologies toward overbuilt infrastructure along with excessive financial fragility. Each firm, rational on its own, over-commits resources to avoid being shut out of a market that may only support a few winners. Their study puts the resulting over-investment at 1.5 to 3 times the efficient level. The same competitive logic that produces the overbuilding also produces the uncertain but potentially large payoff to whichever firm wins the race, which is what keeps capital flowing in even after the overbuilding becomes apparent to everyone in the contest.
The times therefore call for an assessment of what impact artificial intelligence is currently having, and not having, on the U.S. macroeconomy. We split the discussion into two parts, one assessing AI’s impact on the macro-financial system, the other on the labor market.
The Macro-financial System
What are the current financial realities, and fantasies, surrounding AI?
One of the key metrics for assessing whether equity markets are over- or undervalued is the cyclically adjusted price-earnings ratio, or CAPE. Currently above 40, CAPE is near the level it reached at the peak of the dot-com bubble (Figure 2a). Andrew Atkeson, Jonathan Heathcote, and Fabrizio Perri offer a structural explanation. They argue that valuation ratios have risen above their historical norms over the past 30 years because labor’s share of corporate output has declined while corporate investment has remained relatively weak, which mechanically raises the value of corporations relative to their earnings. Because free cash flow, defined as earnings minus net investment, rose in step with enterprise value from 1980 to mid-2022, the ratio of free cash flow to enterprise value held steady over that period, unlike the standard earnings-based ratio.
Figure 2a. On Cash Flow, Valuations are the Highest Outside the Dot-Com Era
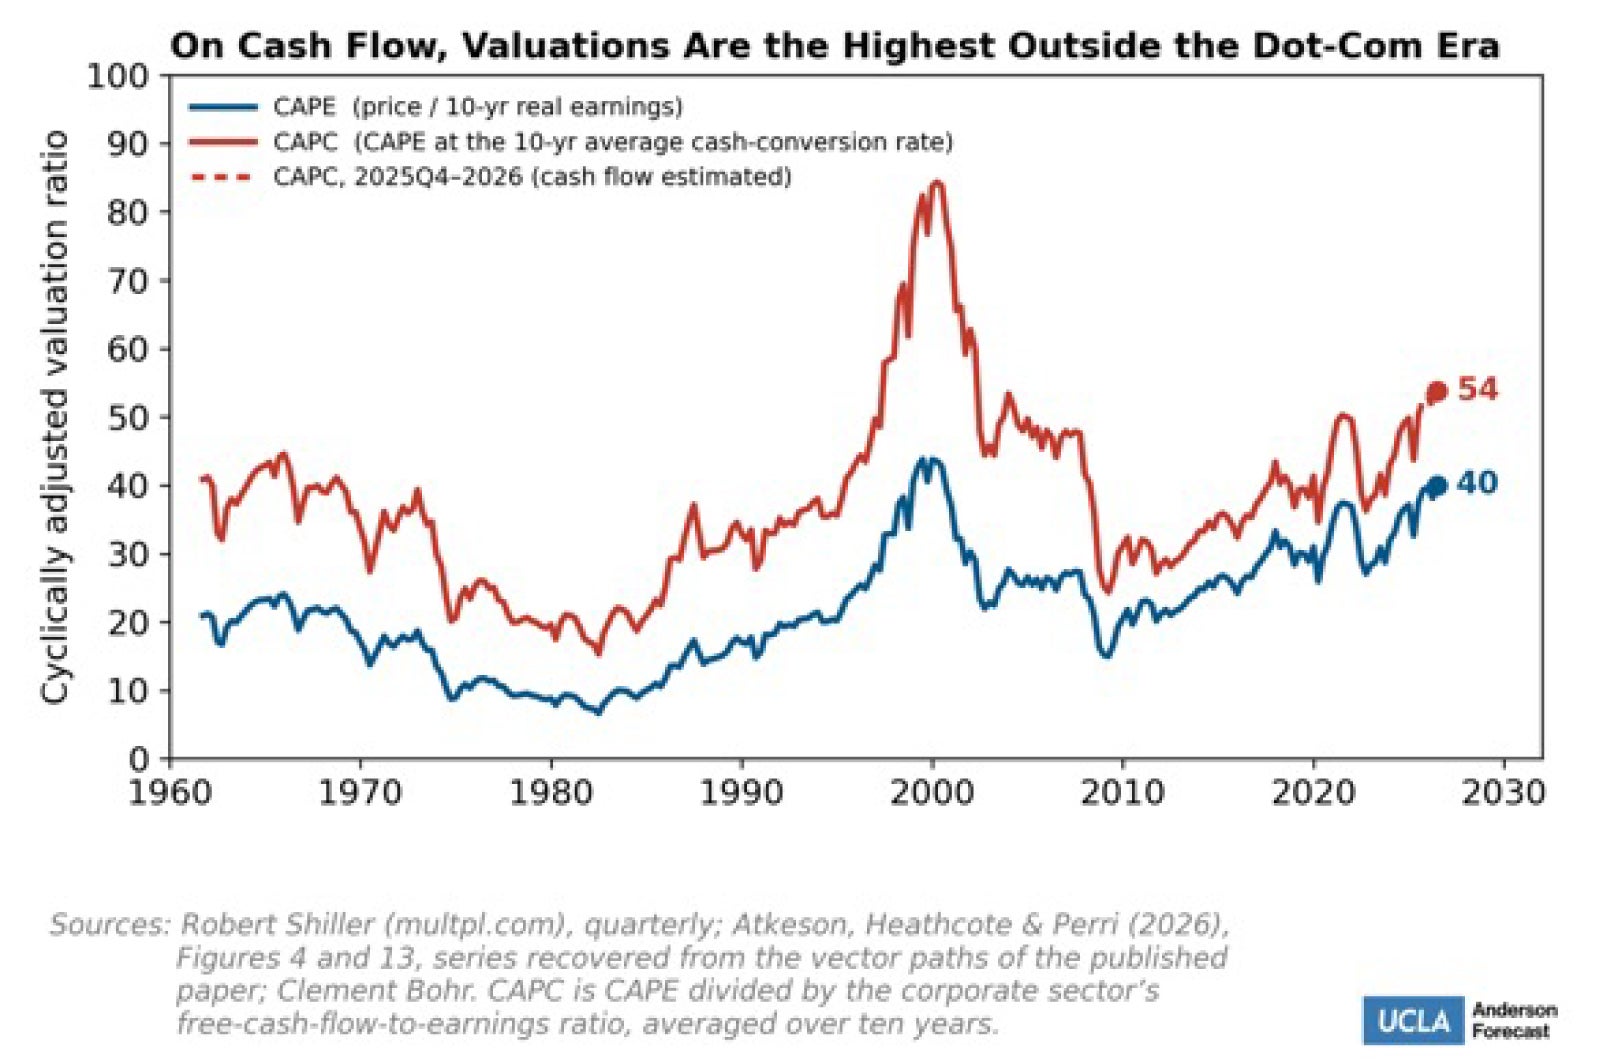
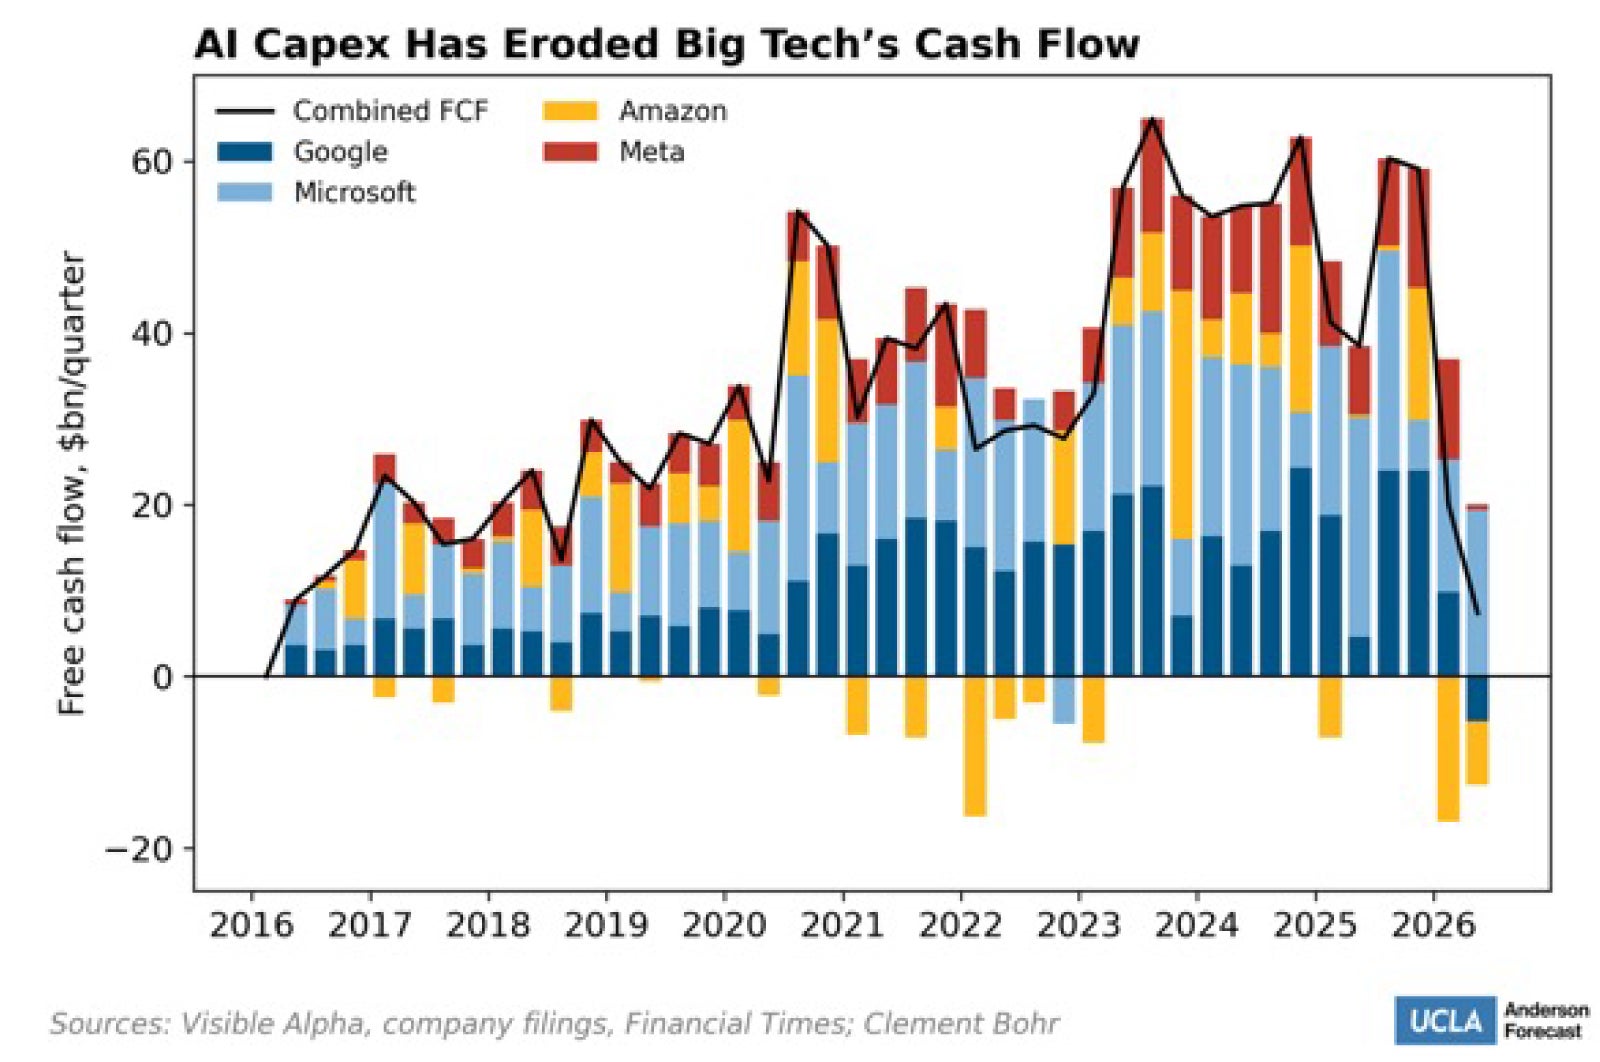
Today, the cyclically adjusted price to free cash flow ratio, or CAPC, is around 54, against an average of 37 over 1961–2019 and above 80 on average in 2000, at the height of the dot-com boom. Relative to their 1961–2019 averages, the cash-flow multiple has risen by far less than the earnings-based one, about 50 percent above its average against roughly double for CAPE, and its current level, while high, is nowhere near its dot-com peak. However, this is changing as free cash flow at the largest technology firms has begun to fall sharply in 2026, as they shift from capital-light to capital-heavy operations. The measure rises by construction during investment booms, since heavy capital spending depresses free cash flow whether or not that spending eventually pays off. That is part of why the dot-com reading was so extreme. Combined free cash flow at the four largest hyperscalers came to $199 billion in 2025. It fell to $20 billion in the first quarter of 2026 and $7 billion in the second, an annualized rate near $30 billion, with Amazon and Alphabet’s turning negative (Figure 2b). If this pace of spending continues, the free cash flow cushion that made high valuations defensible will begin to disappear, and the CAPC valuation will drift further upwards relative to CAPE.
Figure 2b. AI Capex Has Eroded Big Tech's Cash Flow
There are also signs that at least some corners of financial markets have stopped pricing AI exposure on economic fundamentals. The skew in S&P 500 options, a measure of how much more investors pay for protection against a sharp decline than for exposure to a comparable rally, recently fell to its lowest level since mid-2024, according to Cboe. In other words, investors are betting on further upside about as enthusiastically as they are hedging against a downturn, which is unusual, especially for a market already trading at high valuations. It might suggest a concerning level of complacency and a lack of careful risk pricing.
An illustration of this complacency unwinding came in July 2026, when Leopold Aschenbrenner’s Situational Awareness fund, built on highly concentrated AI bets, suffered a sell-off that now ranks as the largest trading loss in history, to the tune of $35 billion. Meanwhile, Allbirds, a shoe company, rebranded itself as NewBird AI in 2026 in a shift to GPU cloud computing. Its stock price surged as much as 600 percent on the announcement, adding roughly $127 million in market capitalization within a day. The timing of the current IPO pipeline of SpaceX, Anthropic, and OpenAI is in part based on this investor enthusiasm. Bringing a company public is as much a question of timing the market as it is of outgrowing what private capital is able to fund.
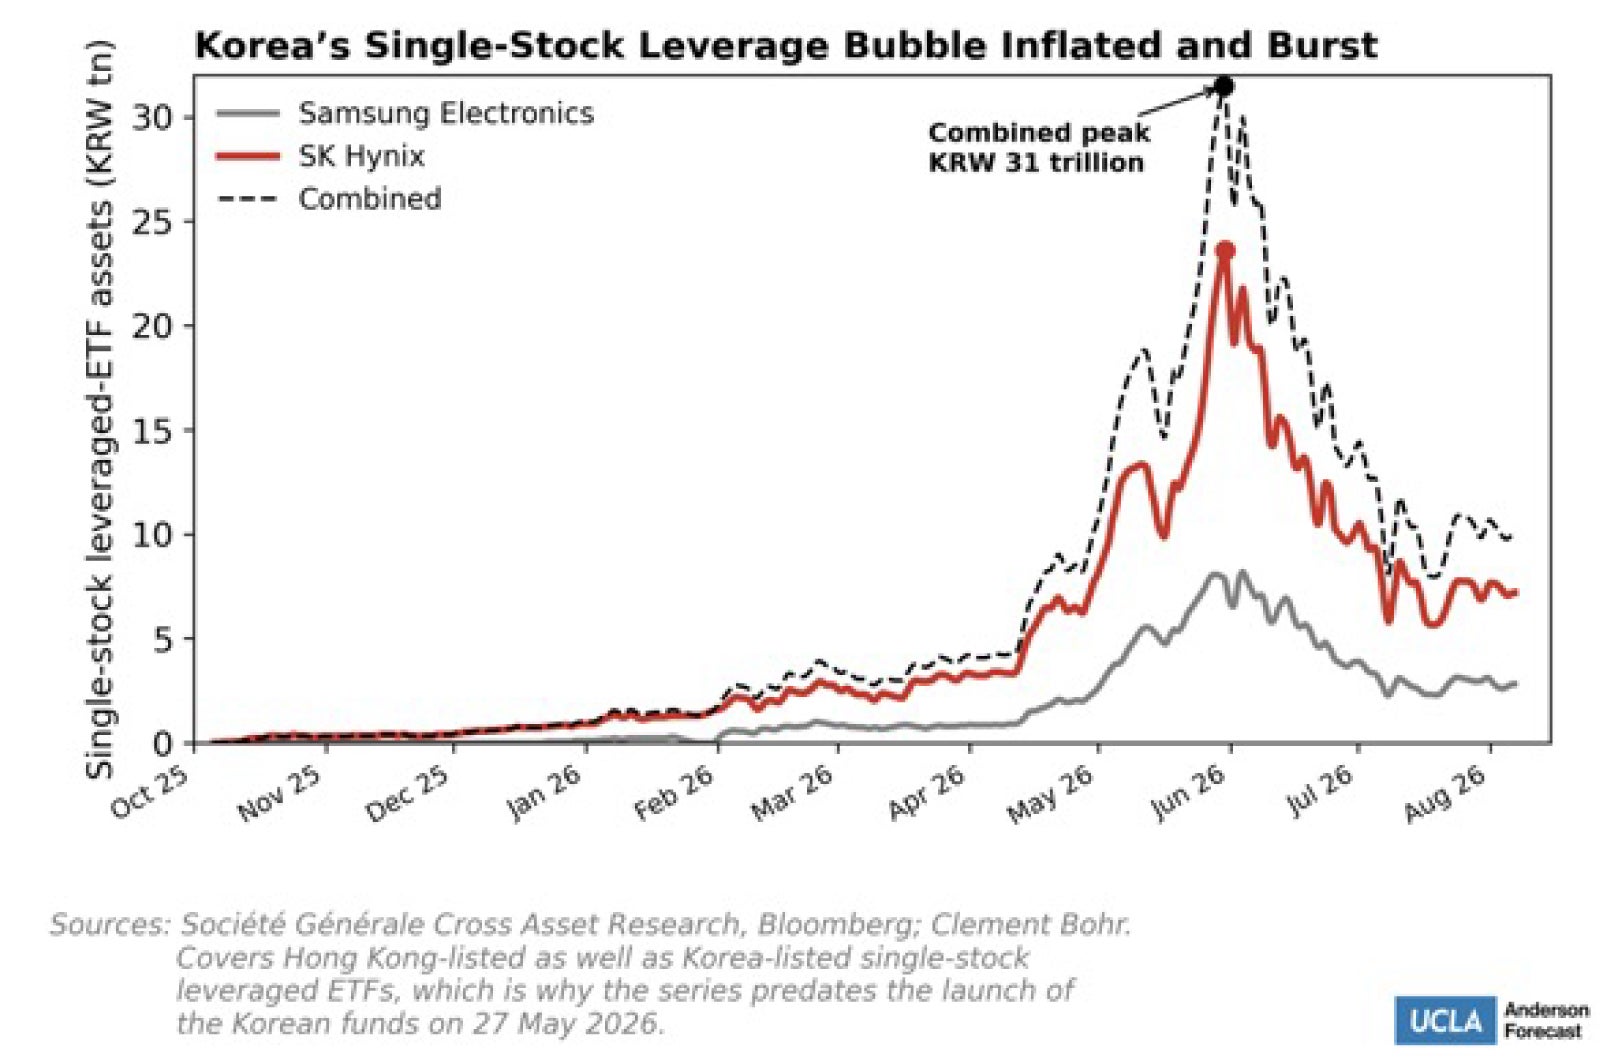
In South Korea, retail investors piled into single-stock leveraged exchange-traded funds tracking SK Hynix and Samsung as the two chipmakers benefited from the AI-driven boom in memory-chip demand. Combined assets in those leveraged funds swelled to roughly ₩31 trillion (about $20 billion) by their June 2026 peak, and by early July, the leveraged funds together with the two underlying stocks accounted for roughly 70 percent of all trading value on the Korean stock market (Figure 3a). The bubble then popped, with the primary Korean stock index, the Kospi, falling 44 percent from its June high. Combined leveraged-ETF trading volume collapsed by roughly 90 percent within about a week of new trading curbs taking effect, and assets in the leveraged funds are down by roughly two-thirds from their June peak. This event is a classic illustration of how leverage can turn a real trade, the AI memory-chip boom, into a bubble.
Figure 3a. Korea's Single-Stock Leverage Bubble Inflated and Burst
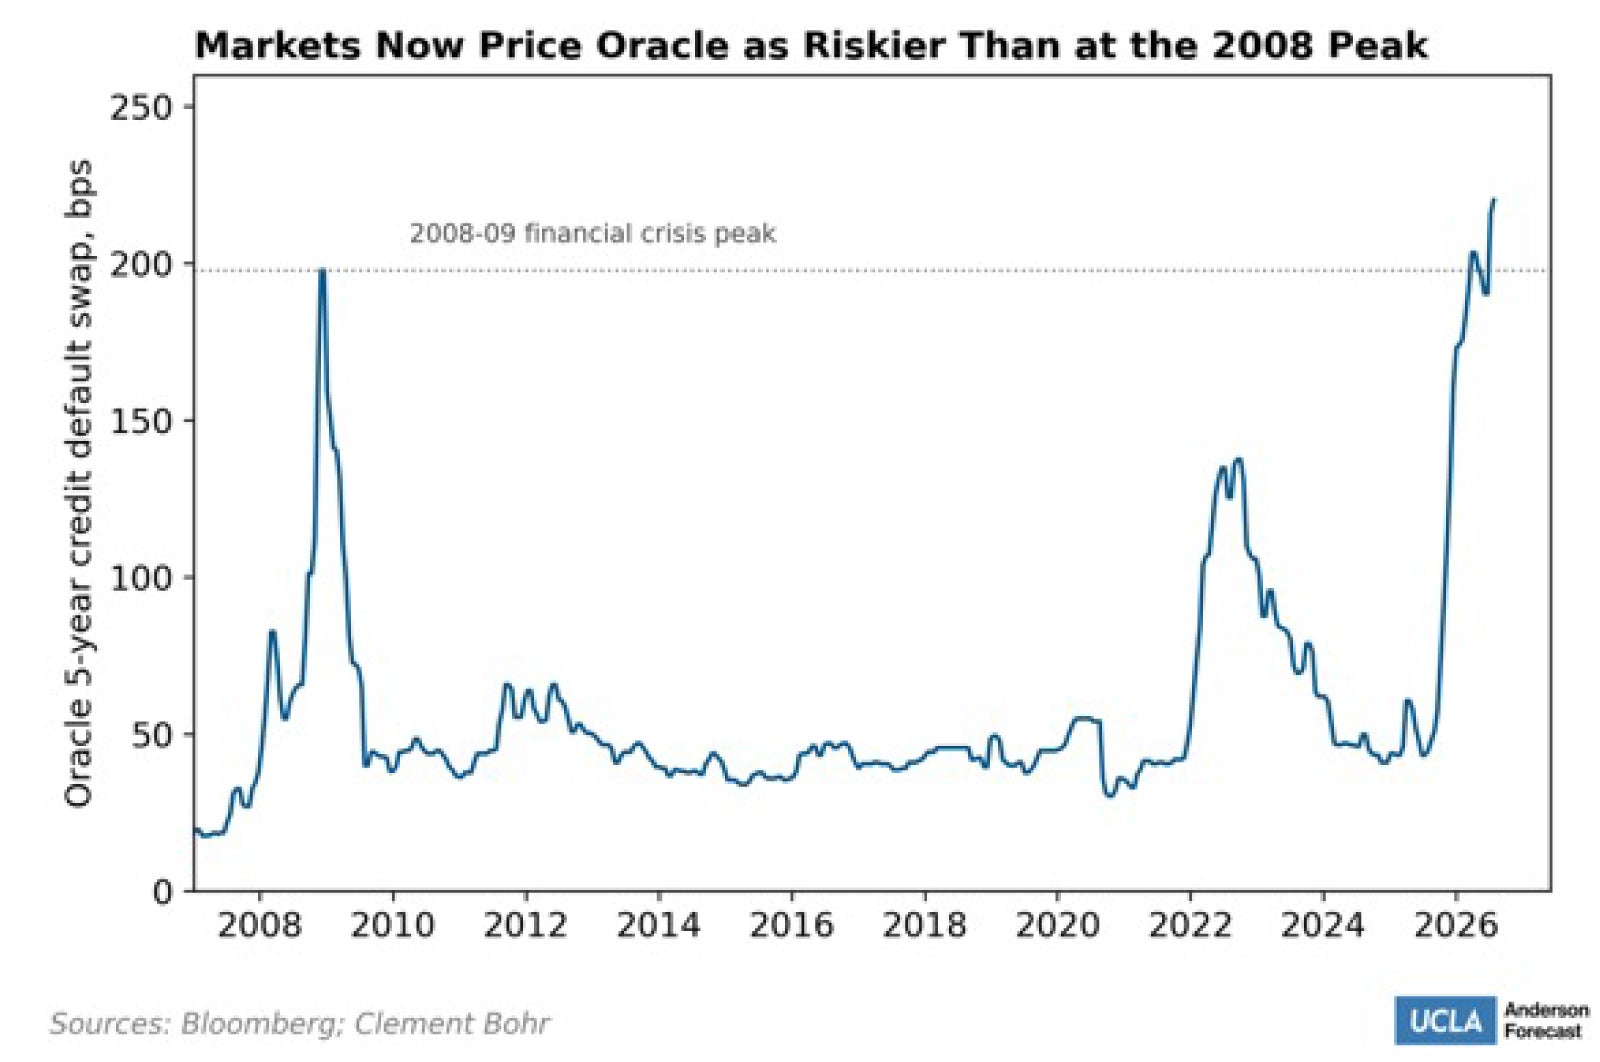
Credit markets are beginning to signal some warning regarding the current financial excesses. Big Tech credit default swap spreads have widened as the companies take on debt to fund the buildout. Oracle’s five-year CDS spread is the starkest example, surpassing the peak it reached during the financial crisis of 2008–09 (Figure 3b).
Figure 3b. Markets now Price Oracle as Riskier Than in the 2008-09 Crisis
Are these financial metrics warranted?
Are we headed for an unprecedented boom, bust, or something more mundane? Answering this means setting the market narrative aside and asking what the underlying macroeconomic realities and fantasies actually are in relation to AI.
Capital Expenditures
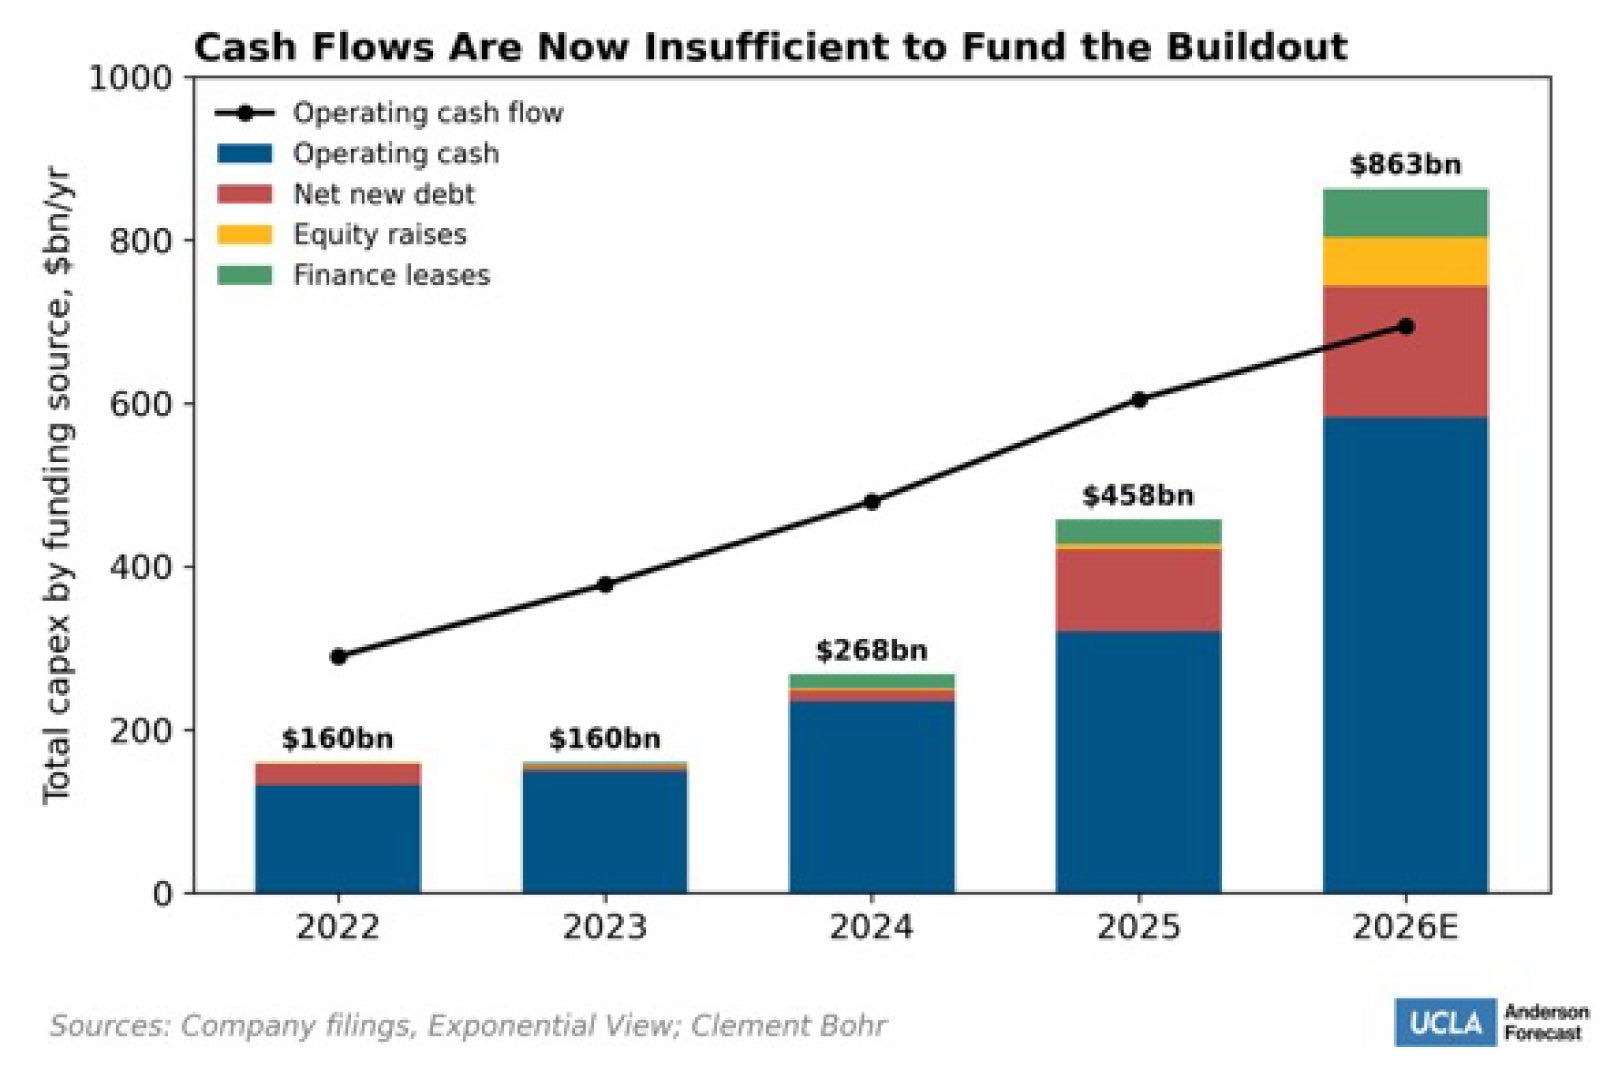
Combined capex among the seven largest AI builders has climbed from $160 billion in 2022, where it stayed through 2023, to a projected $863 billion in 2026. These figures imply some remarkable growth rates of 68 percent in 2024, 71 percent in 2025, and 88 percent in 2026 (Figure 4a). This pace of growth is neither likely nor expected to continue. Big Tech firms have mostly stopped revising their investment plans upward, and their guidance points to growth decelerating in 2027 as annual spending is set to surpass one trillion dollars and increasingly outrun their own free cash flow. Goldman Sachs’s credit strategists put the share of hyperscaler capital spending financed by debt at 27 percent in 2025 and roughly a third in 2026, peaking near 35 percent in 2027. They also count close to $500 billion of AI-related debt issuance, of which the hyperscalers account for only 40 percent, with the rest raised by borrowers who have considerably smaller balance sheets.
Figure 4a. Cash Flows are Now Insufficient to Fund the Buildout
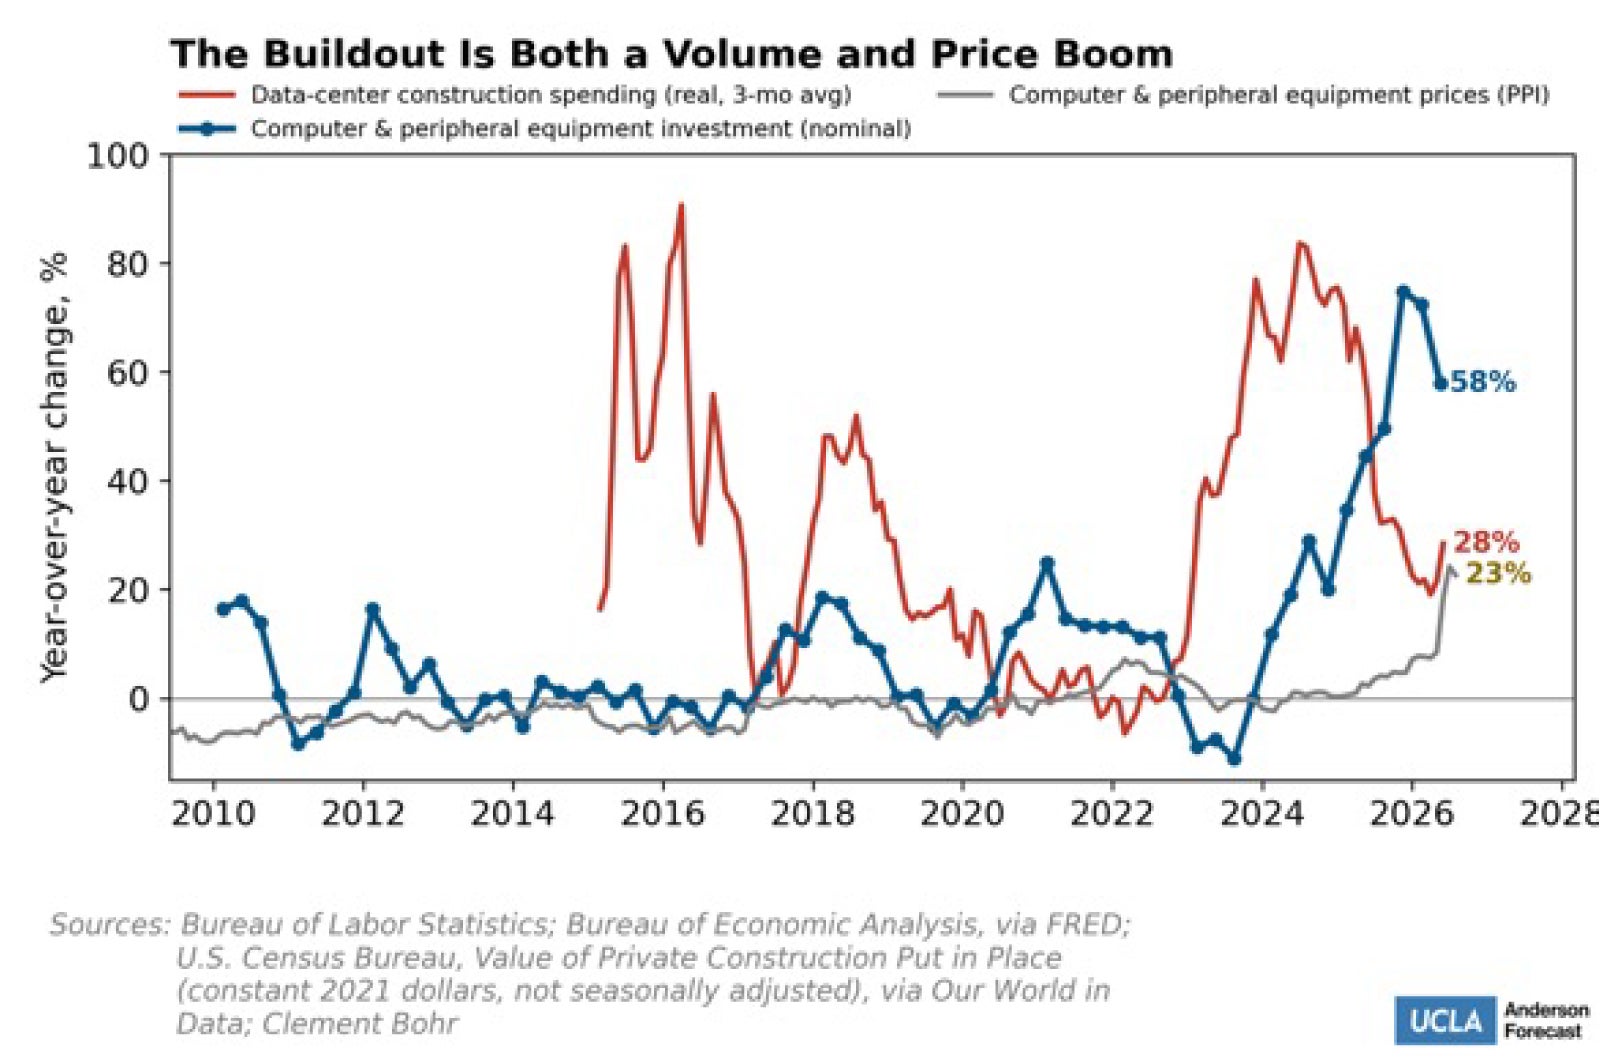
This trillion-dollar buildout is not hard to spot in the construction and investment data, both in quantities and prices (Figure 4b). Private data-center construction spending, measured in constant dollars, swung from an early, small-base boom and bust in 2015–19 to a sustained climb since 2023, peaking near 84 percent year-over-year growth in mid-2024 and cooling to around 20 percent by the spring of 2026. It has reaccelerated since, to 28 percent in June on a three-month average basis and 44 percent in the month of June alone. Business investment in computers and peripheral equipment has followed an even steeper recent path. It was up 75 percent year-over-year in the fourth quarter of 2025, 72 percent in the first quarter of 2026, and 58 percent in the second. Prices for that same equipment, which historically decline over time, have jumped sharply in the last few months, to 23 percent year-over-year in August, likely reflecting the broader AI-driven memory-chip shortage now passing through into finished computer-equipment prices.
Figure 4b. The Buildout is Both a Volume and Price Boom
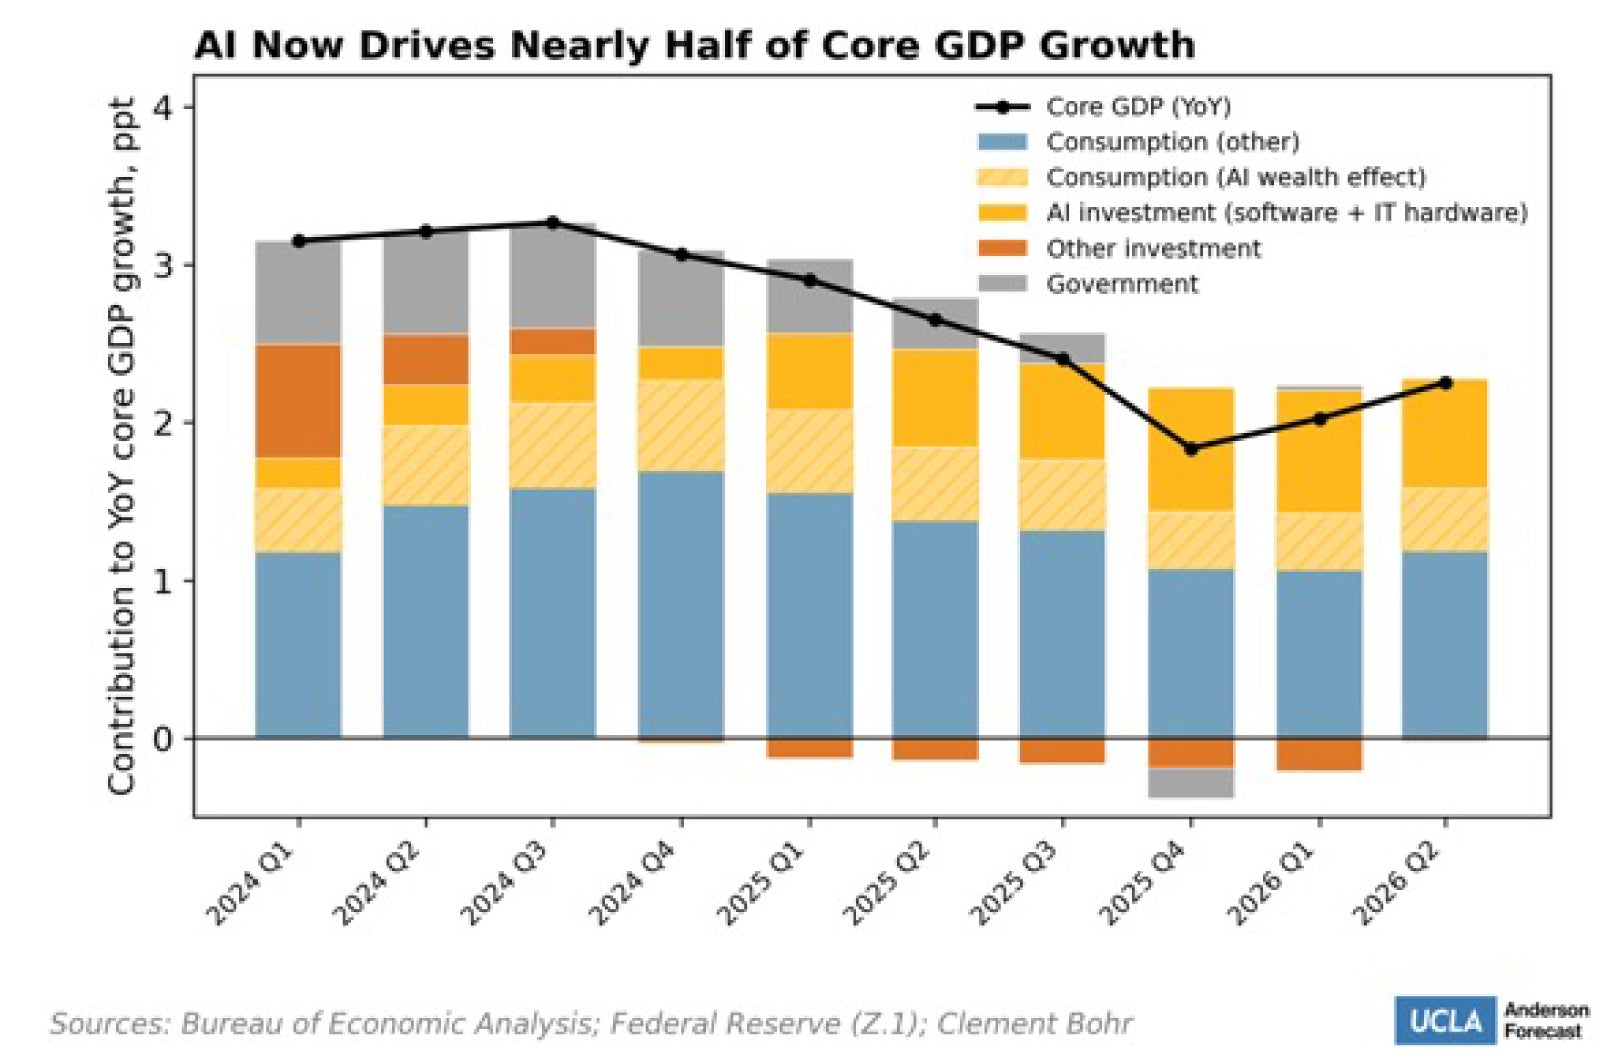
AI-related investment in software and information-processing equipment, together with the AI-driven wealth effect on consumption described below, accounted for nearly half of core GDP growth over the year through the second quarter of 2026 (Figure 5a).2] Stripping that contribution out, and disregarding any crowding-out effects it has had, the remaining economy has been growing noticeably more slowly than the headline figures suggest.
Figure 5a. AI Now Drives Nearly Half of Core GDP Growth
Earnings growth
The revenues attributable to AI are growing fast. The current run-rate revenue across the major AI providers is somewhere between $150 and $217.5 billion on The Economist’s account. Cumulative AI infrastructure capex among the seven largest builders since 2022 amounts to about $1.9 trillion (Figure 4a). Recovering this capital over a (generous) six-year depreciation schedule at a 10 percent required rate of return costs about $440 billion a year. Epoch AI’s estimate that electricity, cooling, bandwidth and staff make up about a tenth of the annual total cost of ownership of a one-gigawatt facility puts the full annual cost of the buildout near $500 billion. J.P. Morgan Asset Management puts the revenue required for a 10 percent return nearer $650 billion a year. AI revenues are thus short by a factor of two to four. Revenues have been growing rapidly, however. Epoch AI finds that combined revenue at OpenAI and Anthropic tripled in 2024, more than quadrupled in 2025, and has grown 3.5-fold so far in 2026. Even if total industry revenues only double each year, this hurdle may be within reach in a few years. But capex continues to grow as well, raising the hurdle at the same time.
The broader pattern of strong corporate earnings growth in the US is not itself an AI story. Reporting in the Wall Street Journal has traced a meaningful share of 2026’s corporate profit growth to tariff refunds and to investment gains on the equity stakes held by Amazon and Alphabet, rather than to AI-driven productivity gains. AI equity valuation gains have also boosted consumer spending, thereby supporting corporate earnings growth. Household holdings of corporate equities and mutual-fund shares rose from $34 trillion at the end of 2022 to $56 trillion at the end of 2025. Attributing half of that $22 trillion gain to AI, and applying a marginal propensity to consume out of wealth of 4 percent, raises the level of consumer spending by about $450 billion by the end of 2025, or roughly $150 billion a year of additional spending over the three years. This spending amounts to about a quarter of the growth in real consumption and a fifth of real GDP growth, which is about half a percentage point of GDP a year (Figure 5a). That is a meaningful but fragile contribution to aggregate growth. It depends on AI-related equity valuations continuing to hold at a moment when the personal saving rate has been hovering at or below 3 percent.
Circular financing
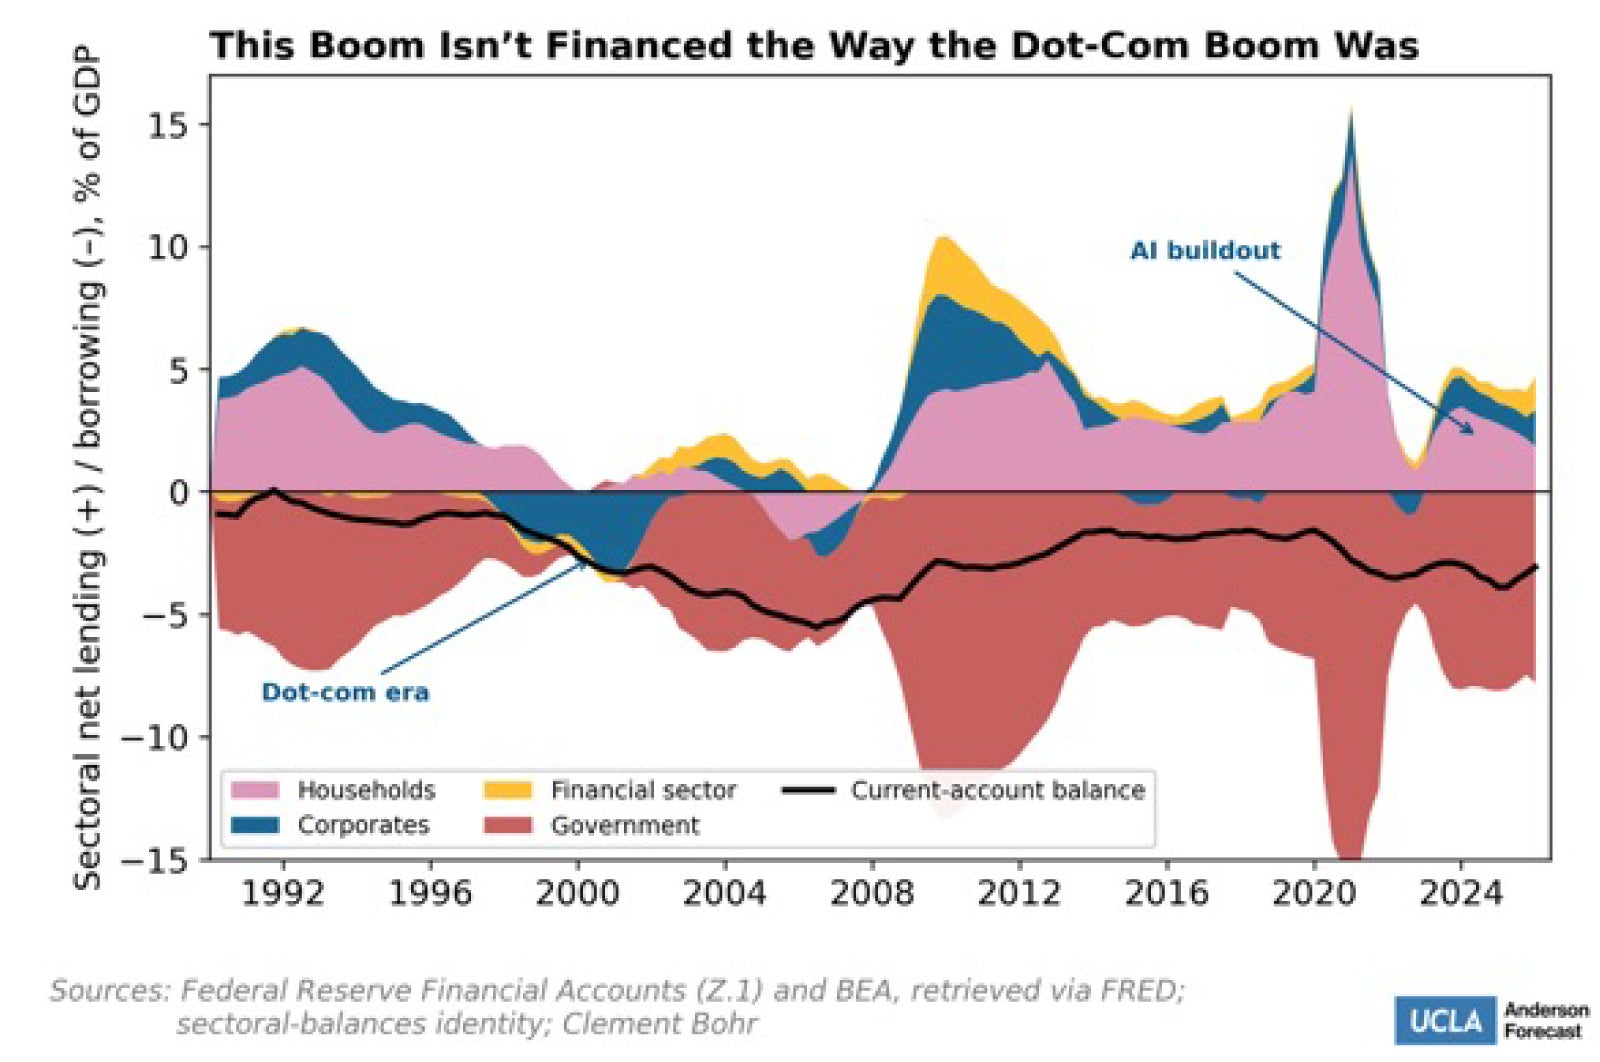
Robin Brooks decomposed the U.S. sectoral saving-investment balance to show that corporations are currently running as net savers rather than net borrowers. This is a sharp contrast with the corporate sector’s position during the dot-com bubble and a reflection of the profitability of the hyperscalers currently funding much of the buildout (Figure 5b). Up to 2025, this boom remained mostly self-funded by highly profitable companies rather than mostly financed by external debt the way the telecom buildout of the late 1990s was. The funding has begun to shift toward debt financing as mentioned above (Figure 4a). Moreover, much of AI financing has grown increasingly off-balance-sheet, routed through future spending commitments and vendor-financing arrangements that do not show up neatly in any single company’s reported leverage. The Wall Street Journal counts around $3 trillion of off-balance-sheet commitments at nine large technology companies. There is a concern that a meaningful amount of hidden risk is being built up in the financial system.
Figure 5b. This Boom Isn't Finances the Way the Dot-Com Boom Was
Nvidia is at the center of this financing structure, as it is both the industry’s dominant supplier and, increasingly, one of its principal financiers. The Financial Times puts Nvidia’s balance-sheet exposure across these arrangements near $200 billion once contingent and off-balance-sheet commitments are counted. Circular financing of this kind is not inherently unsound. A supplier with a strong balance sheet extending credit to its customers is a familiar feature of capital-intensive industries. But it does mean that a disappointment in AI demand could lead to a much larger unraveling, and the chip industry, which is currently financing this one, is notoriously cyclical.
The Labor Market
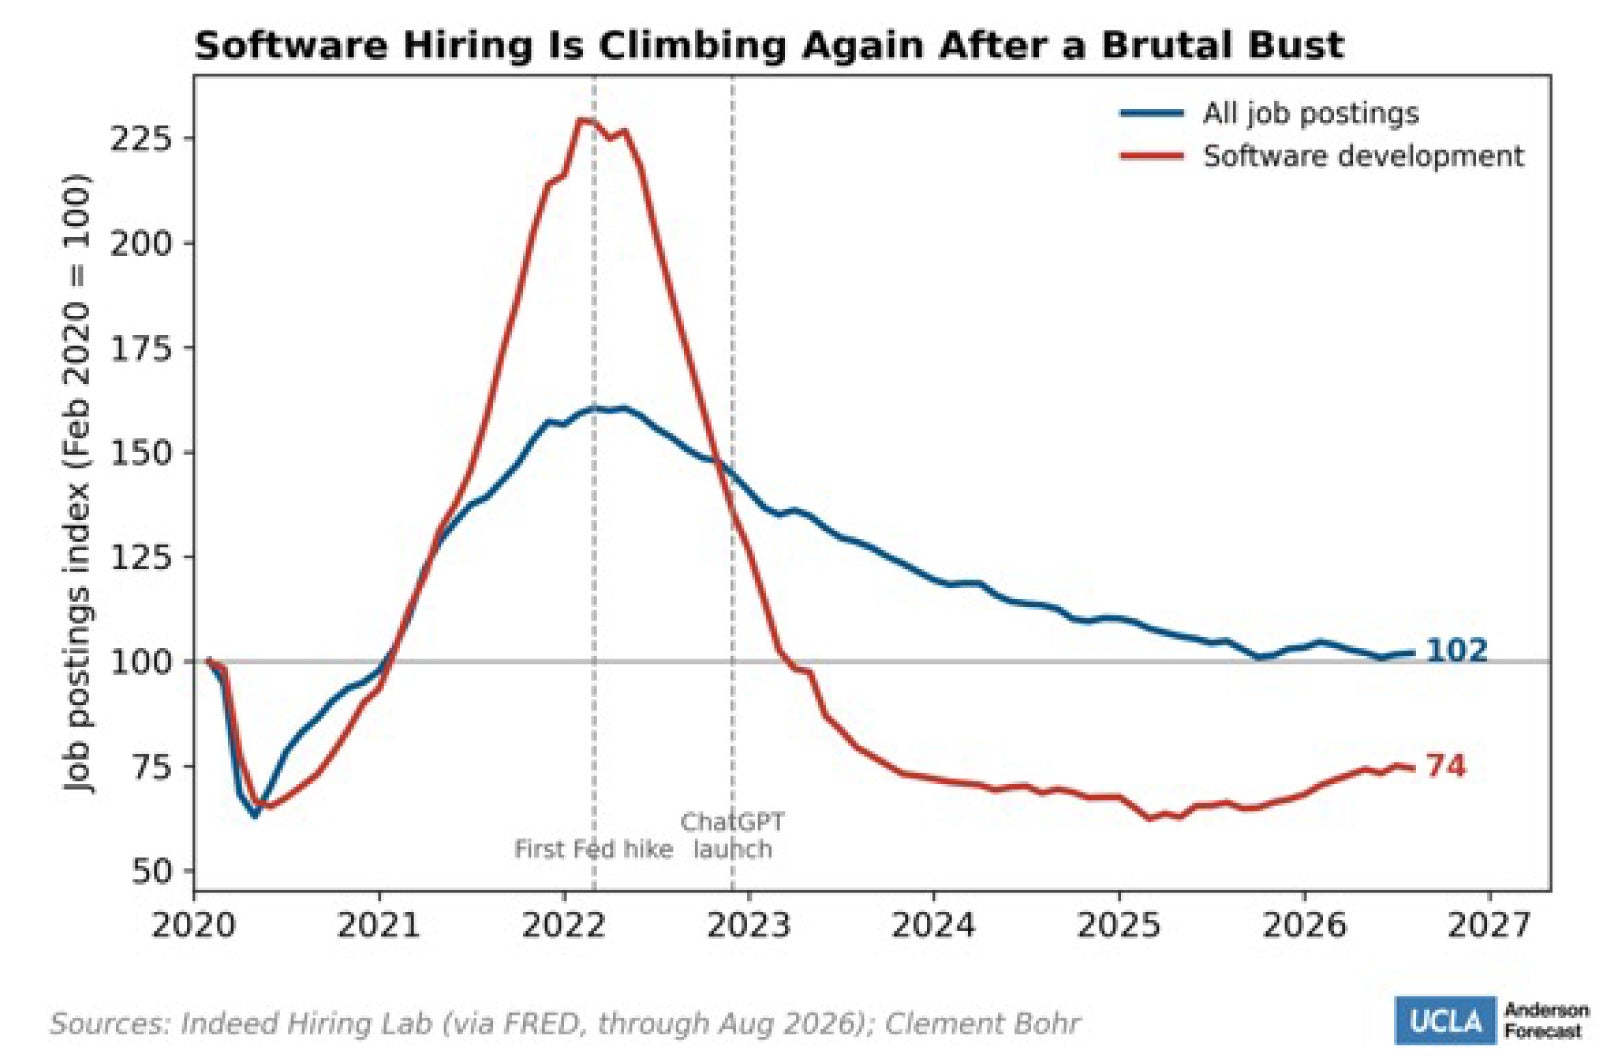
Overall employment growth has slowed to a trickle, and technology hiring in particular has gone from boom to bust since 2022, but neither of these patterns requires an AI explanation. Software-development job postings, tracked by Indeed, are in fact recovering, up roughly 20 percent from their 2025 trough even as overall job postings have drifted down (Figure 6a). Technology firms hired aggressively during the post-pandemic boom, and the pullback since has been, to a considerable degree, a correction of that overhiring. That boom was partly due to the near-zero interest rate environment at the time, and the Federal Reserve’s subsequent rate increases were widely expected to tip the economy into recession in 2023. That recession never arrived, but the tightening was sufficient to cool the labor market meaningfully.
Figure 6a. Software Hiring is Climbing Again After a Brutal Bust
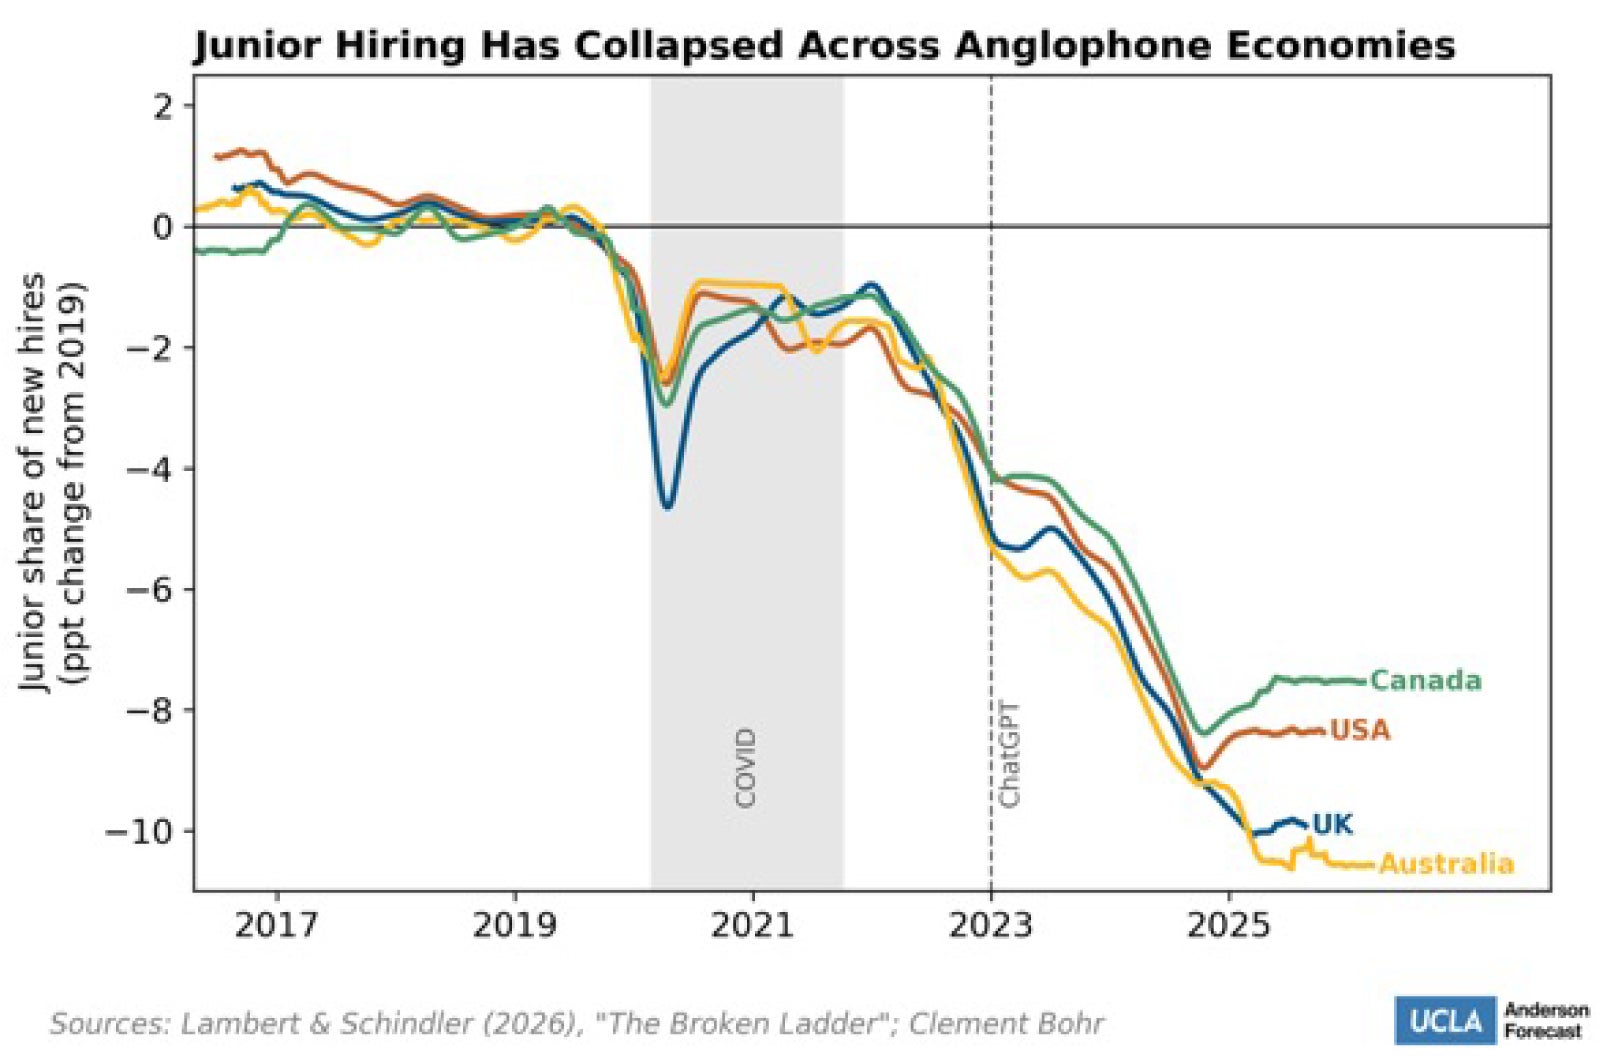
Overall employment growth is unusually low, though this appears to be driven mainly by immigration and demographic trends. Employment cannot grow if the labor force is not growing when the economy is at full employment. Youth hiring has also fallen by more than what a standard business-cycle fluctuation would predict. The junior share of new hires now sits 8 to 11 percentage points below its 2019 level across the United States, the United Kingdom, Canada, and Australia (Figure 6b).
Figure 6b. Junior Hiring Has Collapsed Across Anglophone Economies
New business formation has also recently shifted to a higher rate, and it is being driven disproportionately by non-employer businesses. Solo business applications are up more than 20 percent since early 2025, while applications from prospective employers have been broadly flat. Close to half of the increase in solo applications has come from technology, finance, and professional services, the sectors where AI adoption is highest.
What can be attributed to AI?
There is already no shortage of studies attempting to assess the effect that AI is having on the labor market. Collectively, they can support almost any narrative one wants to believe.3] The findings that have gained the most traction are the potential effects that AI has had on reducing junior hiring and inhibiting wage growth of those occupations most exposed to it. Few individual studies are more than suggestive in one direction or the other. At this point, there is certainly no conclusive evidence of a large AI impact on the labor market.
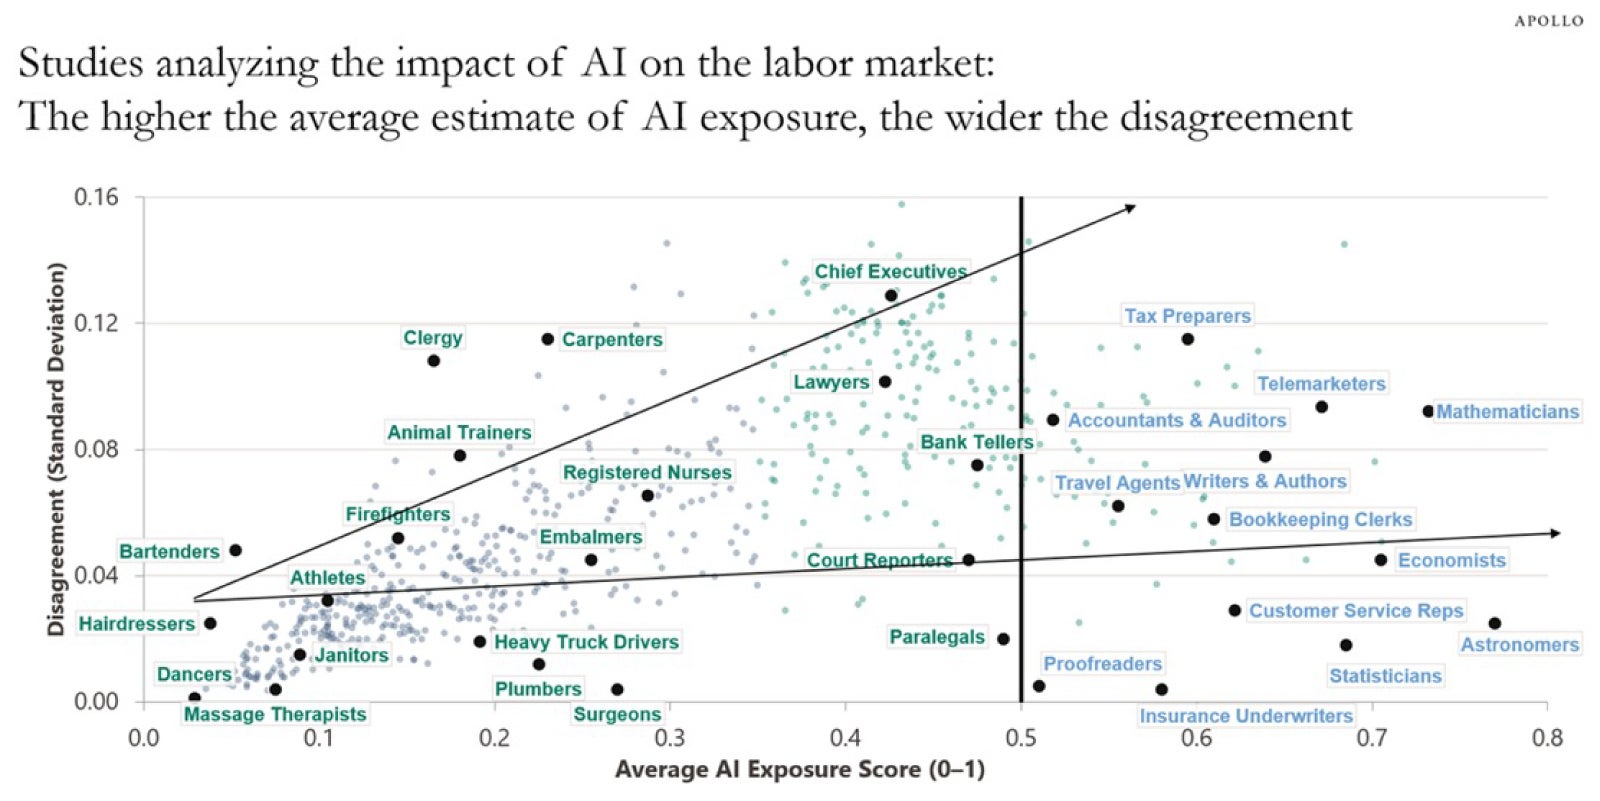
Part of the disagreement has to do with the measurement of AI exposure and AI adoption. There is no single, agreed-upon way to measure an occupation’s exposure to AI, and whether that exposure is one that augments or displaces it. Because of this, there is a plethora of different measures that do not always agree with one another. Apollo’s Torsten Sløk created a compilation of exposure studies showing that disagreement is larger when exposure estimates are higher (Figure 7).
Figure 7. The More AI-Exposed the Job, The Less Studies Agree
AI adoption measures also disagree, as the St. Louis Fed points out. They range widely, depending on who is surveyed and how the question is worded. When the Census Bureau’s Business Trends and Outlook Survey changed its own question wording in November 2025, from whether a business had used AI in producing goods or services to whether it had used AI in any of its business functions, the measured adoption rate stepped up from about 10 percent to about 17 percent in a single month. Adoption rises to 37 percent among larger firms, but even adopting firms still typically use AI to supplement only a small number of business functions rather than to restructure how the business operates. The reason businesses most often give for not adopting is that they do not think AI applies to their business.
Further muddying the waters is the practice of AI washing, in which corporations attribute layoffs to AI for public-relations reasons. In a Resume.org survey of 1,000 hiring managers fielded in December 2025, 59 percent admitted to playing up AI’s role in layoffs and hiring freezes because the narrative sits better with stakeholders than an admission of financial strain, while only 9 percent said AI had actually replaced roles at their firm. Challenger, Gray & Christmas data, which attributed 54,836 announced job cuts in 2025 to AI against only 7,908 to tariffs, should thus be read with that incentive in mind. It is also worth keeping the scale of individual layoff announcements in perspective. Something on the order of 1.7 million layoffs happen every month in the United States in the ordinary course of business, which means any single company’s job-cut announcement, however prominently covered by the media, is rarely informative about the economy-wide pattern.
What does remote work have to do with AI?
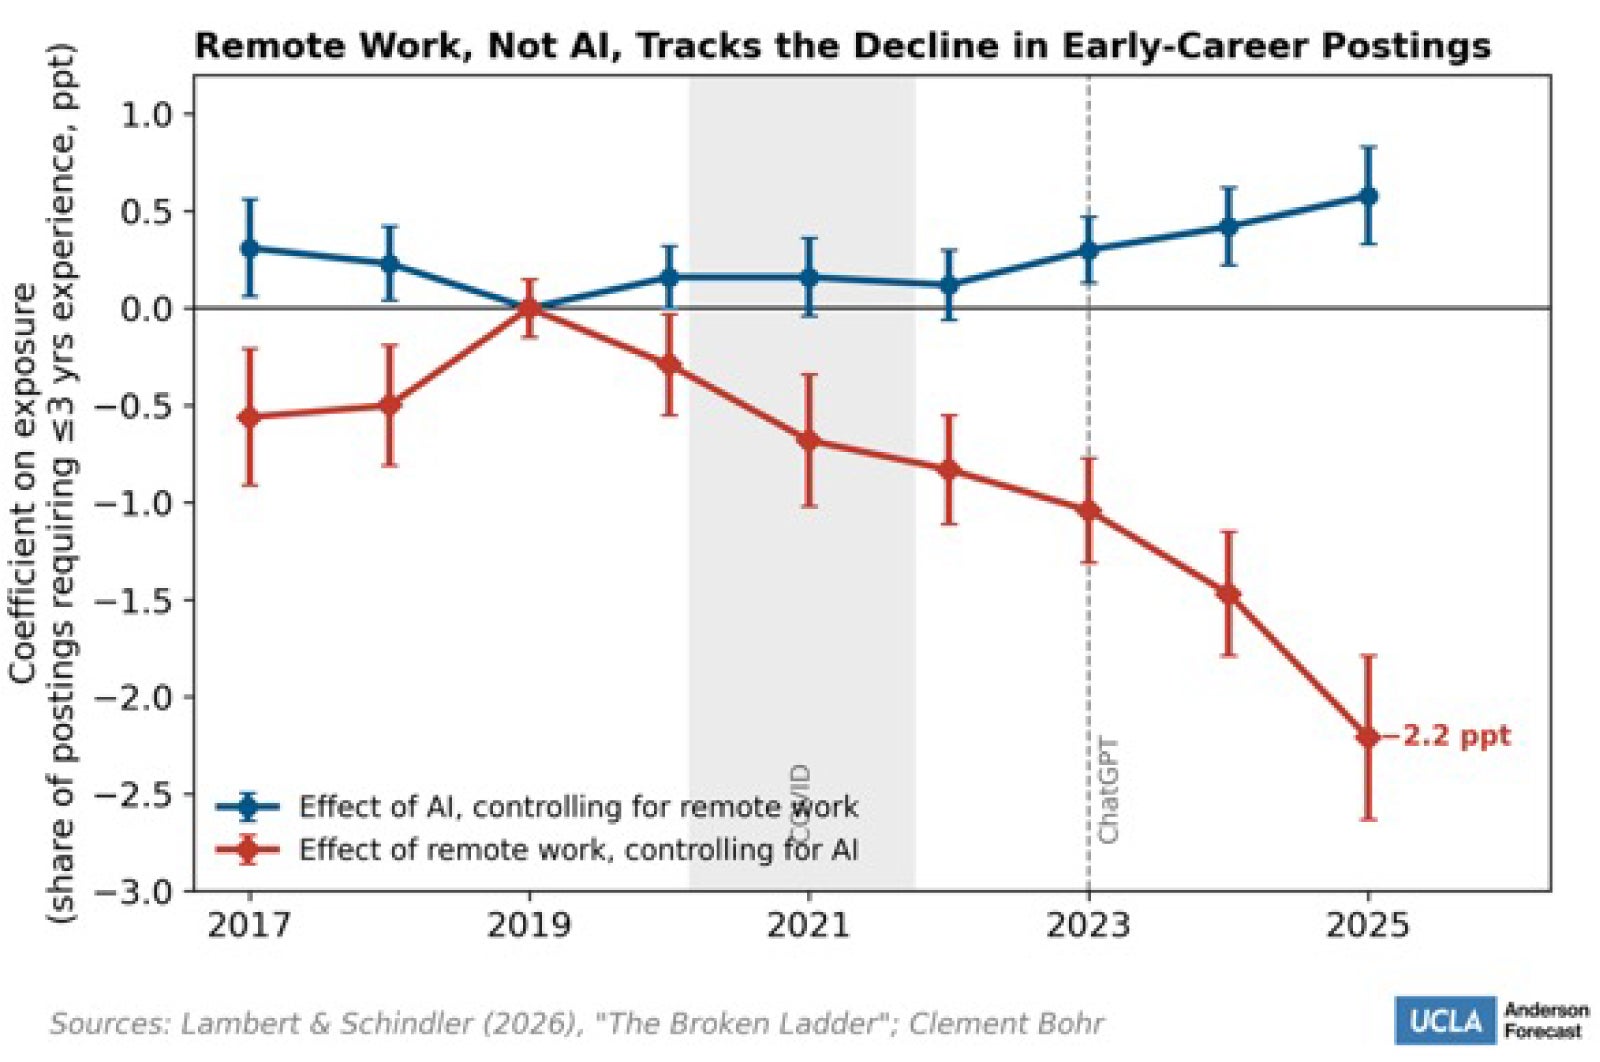
The shift to working from home accelerated sharply during the pandemic, before generative AI tools began appearing. Remote work makes coaching and supervising junior employees harder, leading to reductions in junior hiring through a similar mechanism that is often attributed to AI. Consistent with that account, Lambert and Schindler find that the occupations most exposed to remote work turn out to be the same occupations most exposed to generative AI (Figure 8a). The shift to remote work also fits the timing better than the introduction of generative AI, with the decline in early-career postings beginning around 2020. More importantly, once remote-work exposure is controlled for, AI exposure no longer predicts a significant decline in early-career job postings (or hiring), while the remote-work effect remains present when controlling for AI (Figure 8b).
Figure 8a. WFH and GenAI Exposure Are Highly Correlated Across Companies
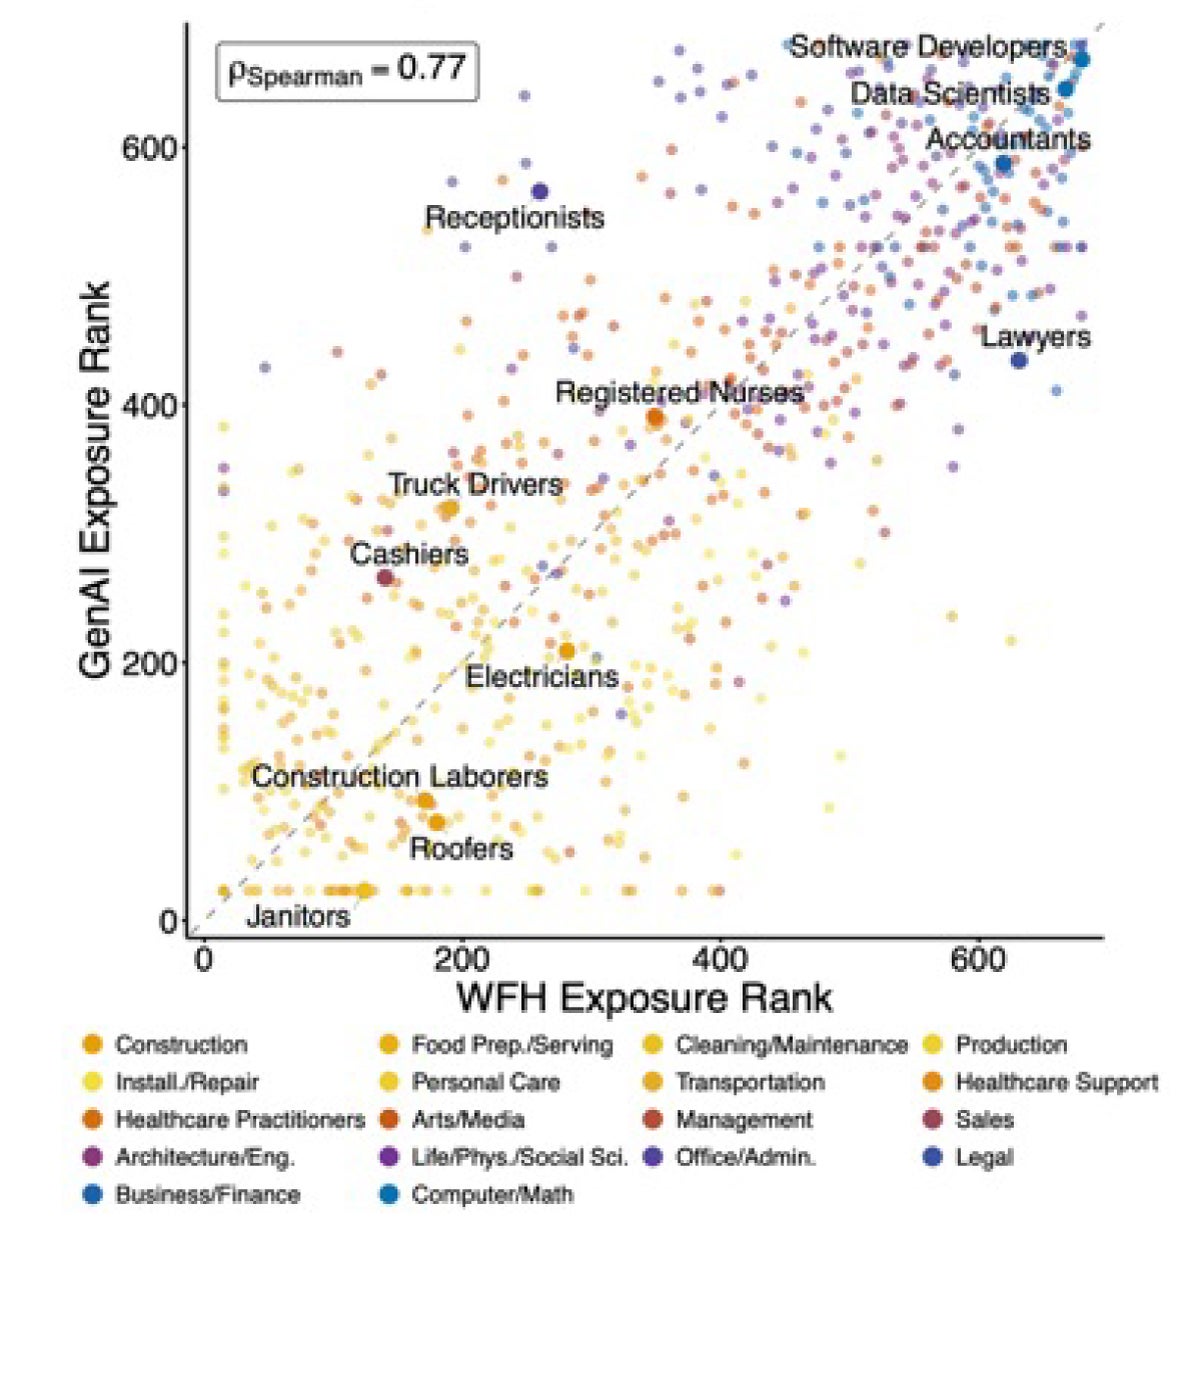
Figure 8b. Remote Work, Not AI Tracks the Decline in Early Career Postings
The work of Gregor Schubert, here at UCLA Anderson, adds another layer of nuance that does not require picking a winner between whether remote work or AI is inhibiting junior hiring. Schubert shows that remote-work adoption itself drives firms’ later AI adoption. Firms that hired remotely in 2021 and 2022 shifted toward technical and managerial talent, and that capability lowered the cost of adopting generative AI in 2023 and 2024, with a ten-percentage-point increase in remote hiring predicting a 0.4 to 0.7 percentage-point rise in AI adoption. If remote work sits upstream of AI adoption, the two are not competing explanations at all but successive rungs on the same ladder, climbed by the same technology-forward firms. Controlling for remote work, as Lambert and Schindler do, would then absorb part of the channel through which AI affects junior hiring.
Productivity growth
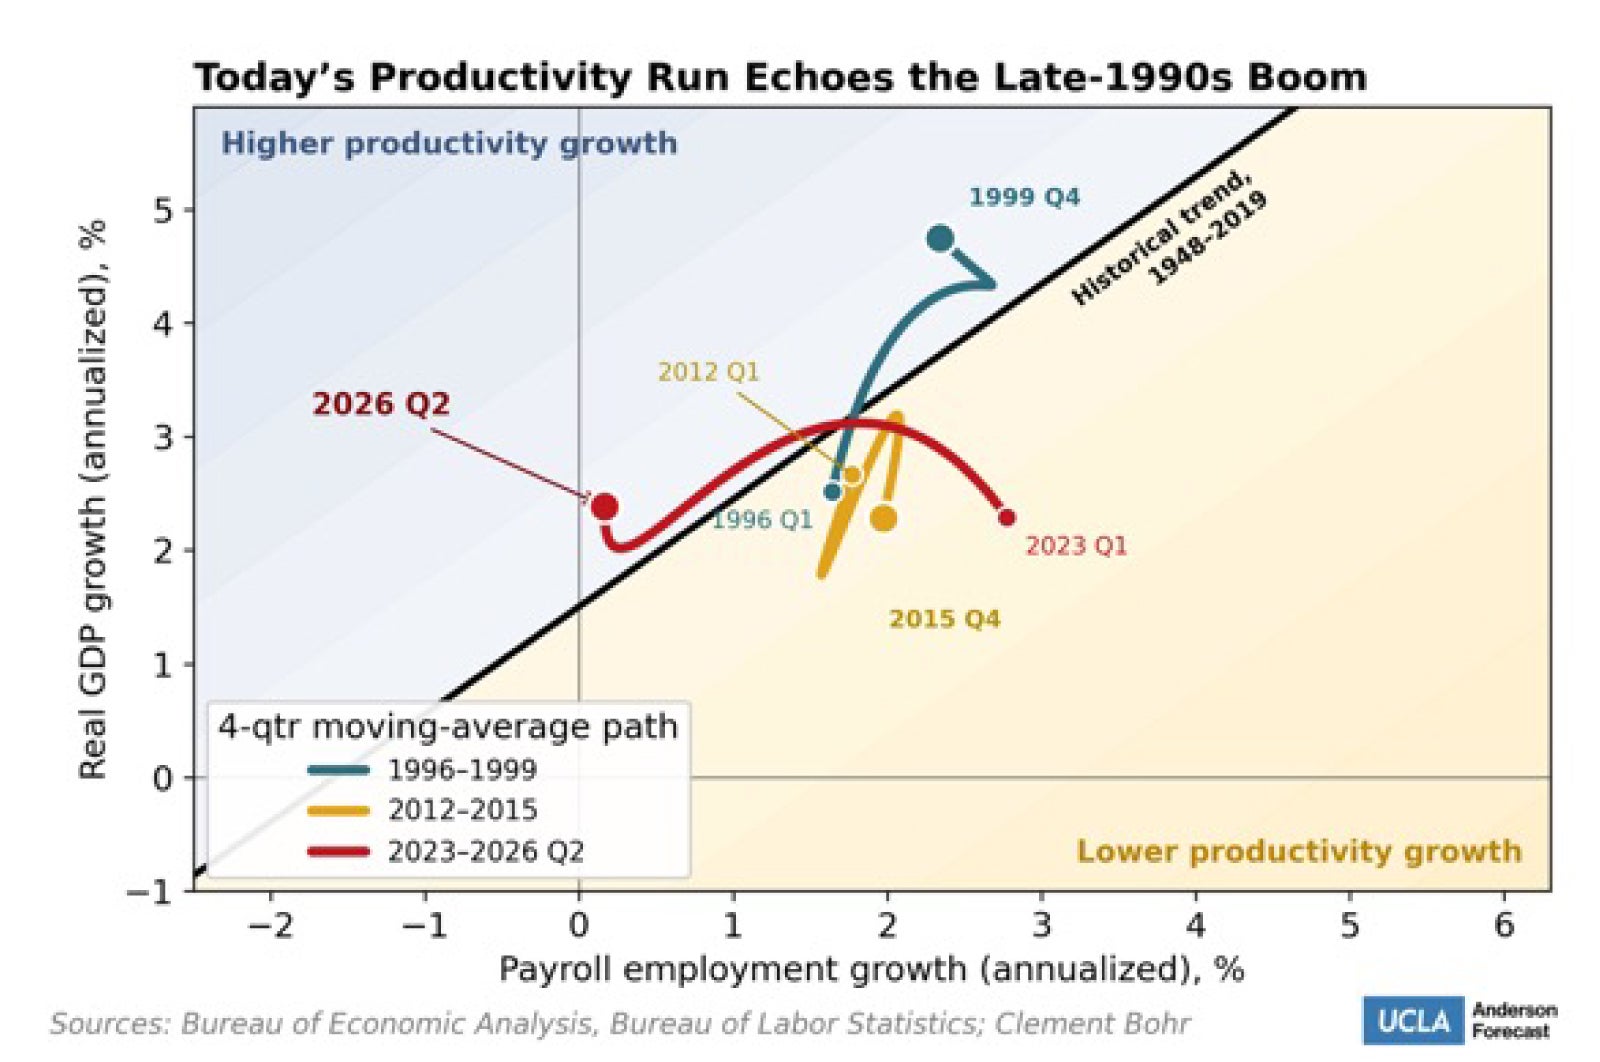
AI is expected to induce anywhere from modest to unprecedented gains in productivity. Measured against the historical relationship between GDP growth and employment growth, the current expansion is only producing marginally more output per unit of job growth than the 1948–2019 average would predict (Figure 9a). Against the depressed productivity growth of the 2010s, this is an improvement, but against the full sweep of postwar history, it looks more like a normalization. There is hope that the economy is on a trajectory similar to that of the late-1990s productivity boom, though so far it is a softer version of it. The economy now sits about 0.4 percentage points above the historical relationship, against roughly 0.8 in late 1999, and with substantially less employment growth.
Figure 9a. Today's Productivity Run Echoes the Late-1990s Boom
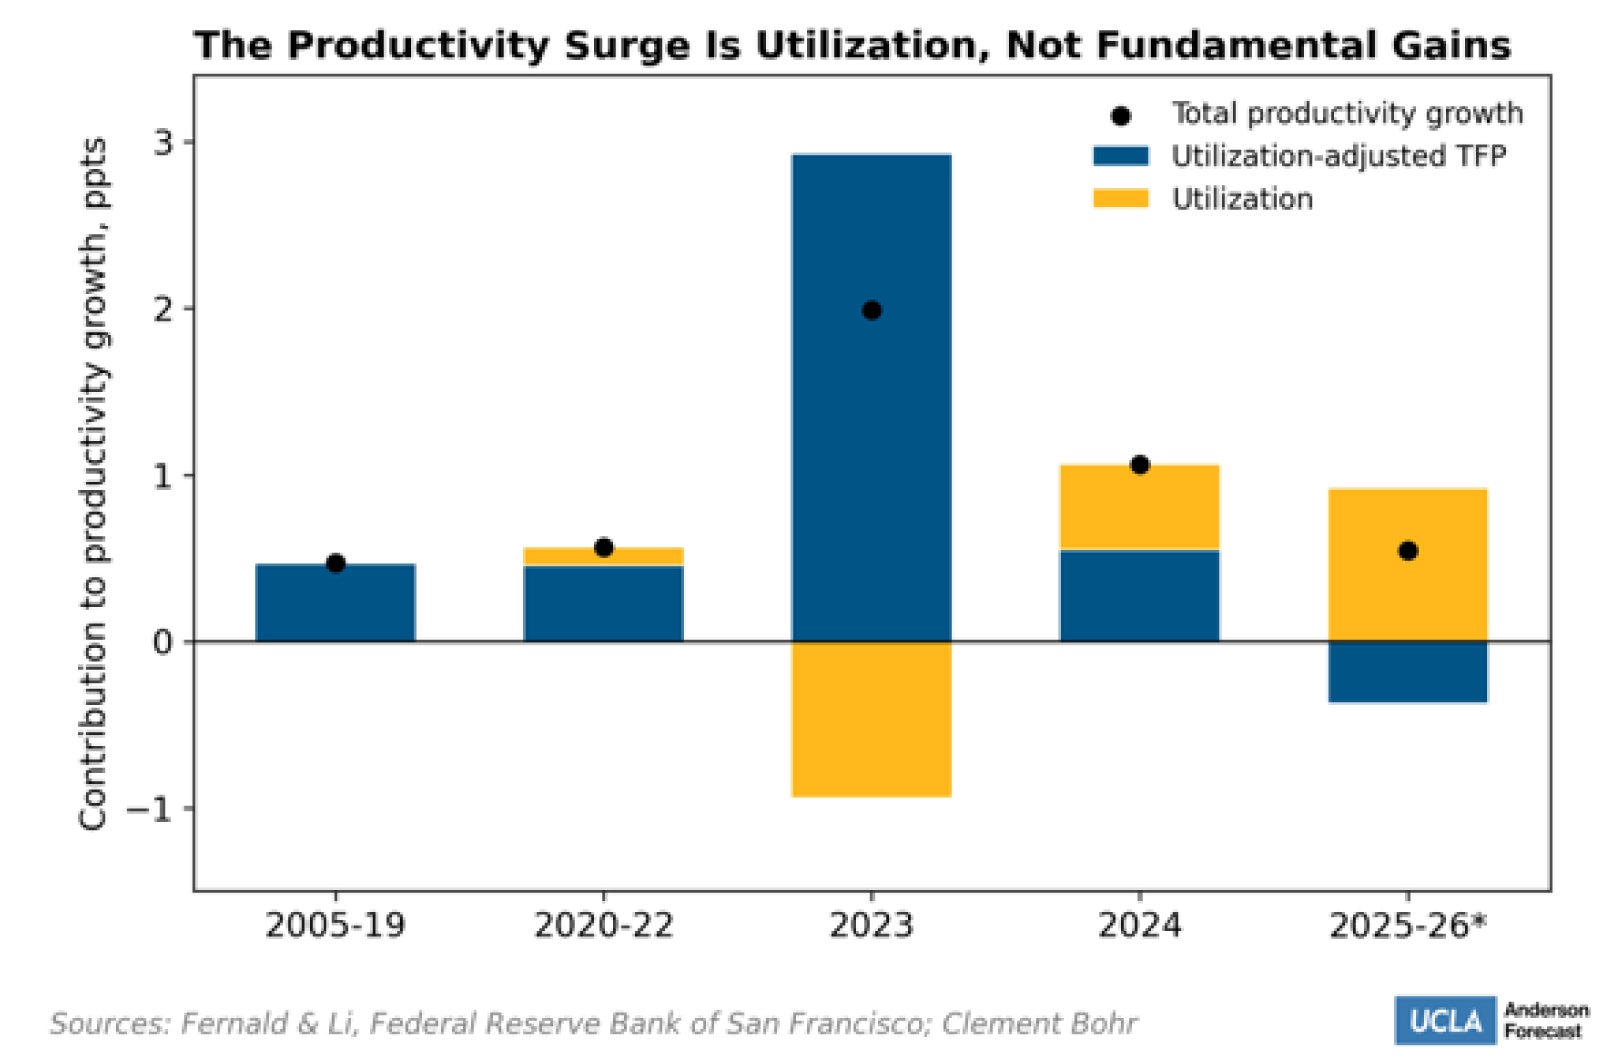
The most recent rise in productivity does not appear to be coming from AI either. Boyle, Fernald, and Li of the Federal Reserve Bank of San Francisco show that since the beginning of 2024, and across 2025 and 2026, higher capacity utilization accounts for essentially all of the growth in total factor productivity, meaning firms are running their existing capital and labor harder rather than becoming more efficient at converting inputs into output in any fundamental sense (Figure 9b). Across 2025 and 2026, utilization-adjusted total factor productivity has been slightly negative even as measured productivity growth stayed positive, a much less encouraging story than the headline numbers suggest.
Figure 9b. The Productive Surge is Utilization, Not Fundamental Gains
Chad Syverson, among the most prominent economists studying productivity, reaches a similar conclusion in his 2026 report, finding no clear evidence that AI is yet moving aggregate productivity. He notes a timing problem for anyone eager to credit AI with the recent uptick. The acceleration began when AI investment was still small relative to the economy, which leans against AI having been its initial cause. However, he does note that even if something else started the acceleration, AI could well be contributing now. If we are willing to ignore the retail sector, higher AI adoption (as measured by the Census Bureau’s Business Trends and Outlook Survey) does loosely line up with larger productivity gains across sectors. The admitted tenuousness of his results underlines one of the main takeaways of this report, which is that it is simply still too soon to make any concrete statement regarding the effects of AI. However, the longer elevated productivity growth persists, the more plausible an AI contribution becomes.
Conclusion
None of this should be read as an argument that AI will fail to transform the economy, and the labor market with it. At the time of this writing, however, while the buildout and financing of AI are having large effects on the macroeconomy, the impact of the technology itself remains marginal to non-existent. When more conclusive evidence arrives, which the economists here at UCLA Anderson Forecast expect it eventually will, we will address it. This may not happen quickly, as new general-purpose technologies have historically taken a long time to be productively absorbed into the economy. AI may move faster than its predecessors given how quickly the underlying tools are already diffusing, but by the evidence available today, we remain at the very beginning of this economic transformation.
Endnotes
1. The vertical axis is the estimated contribution to economy-wide labor-productivity growth, in percentage points a year, averaged over the payoff window given on each label. The spread in window length is one more reason to consider the entire vertical ranges rather than the midpoints. The reported statistics come from refitting the regression 4,000 times, drawing each episode from within its range. Financial manias are left out, since investment in the technology is undefined where there is no technology. The 1920s technologies are treated as one observation.
2. Core GDP here is consumption plus fixed investment plus government, excluding net exports and changes in inventories.
3. See Autor and Thompson (2025); Brynjolfsson, Li and Raymond (2025); Brynjolfsson, Chandar and Chen (2025); Audoly, Guerin and Topa (2026); Liu and Webber (2026); Nunn (2026); and Ozimek and Goldschlag (2026).
Bibliography
Apollo Global Management (Torsten Sløk). “How Exposed Is Your Job to AI? The Experts Can’t Agree.” The Daily Spark, 2026. https://www.apollo.com/insights-news/insights/daily-spark/how-exposed-is-your-job-to-ai---the-experts-cannot-agree
Atkeson, Andrew, Jonathan Heathcote, and Fabrizio Perri. “A Macroeconomic Perspective on Stock Market Valuation Ratios.” NBER Working Paper No. 34748, UCLA and Federal Reserve Bank of Minneapolis, January 2026. https://www.nber.org/papers/w34748
Audoly, Richard, Miles Guerin, and Giorgio Topa. “Do Job Postings Show Early Labor Market Effects of AI?” Liberty Street Economics, Federal Reserve Bank of New York, May 14, 2026. https://libertystreeteconomics.newyorkfed.org/2026/05/do-job-postings-show-early-labor-market-effects-of-ai/
Autor, David, and Neil Thompson. “Expertise.” NBER Working Paper No. 33941, 2025. https://www.nber.org/papers/w33941
Axios. “AI Use Is Behind a Boom in Solo Founders, Nasdaq Finds.” June 9, 2026, reporting Nasdaq Economic Institute analysis of U.S. Census Bureau Business Formation Statistics. https://www.axios.com/2026/06/09/ai-entrepreneurs-founders-nasdaq
Bank of America Global Investment Strategy. AI Big 10 market-concentration series, with GFD Finaeon and Bloomberg. 2026.
Bipartisan Policy Center. “AI and the Workforce: What Is Actually Going On Inside American Firms?” 2026, reporting the Census Bureau’s Business Trends and Outlook Survey artificial-intelligence supplement, November 2025–February 2026. https://bipartisanpolicy.org/article/ai-and-the-workforce-what-is-actually-going-on-inside-american-firms/
Bloomberg. Oracle Corp. five-year senior credit default swap spread, daily. Accessed September 2026.
Bloomberg. “South Korea’s Leveraged ETF Trading Plummets Under New Curbs.” August 2026. https://www.bloomberg.com/news/articles/2026-08-04/south-korea-s-leveraged-etf-trading-plummets-under-new-curbs
Board of Governors of the Federal Reserve System. Financial Accounts of the United States (Z.1): households and nonprofit organizations; corporate equities and mutual fund shares, level (BOGZ1LM193064005Q). Via FRED, Federal Reserve Bank of St. Louis. Accessed September 2026. https://fred.stlouisfed.org/series/BOGZ1LM193064005Q
Boyle, Shane, John Fernald, and Huiyu Li. “Higher Utilisation Explains Recent Surge in Productivity Growth.” VoxEU/CEPR, 2026. https://cepr.org/voxeu/columns/higher-utilisation-explains-recent-surge-productivity-growth
Brooks, Robin J. “Is the AI Buildout Pushing Up Yields?” 2026. https://robinjbrooks.substack.com/p/is-the-ai-buildout-pushing-up-yields
Brynjolfsson, Erik, Bharat Chandar, and Ruyu Chen. “Canaries in the Coal Mine? Six Facts about the Recent Employment Effects of Artificial Intelligence.” Stanford Digital Economy Lab, November 2025, revised August 2026. https://digitaleconomy.stanford.edu/app/uploads/2025/11/CanariesintheCoalMine_Nov25.pdf
Brynjolfsson, Erik, Danielle Li, and Lindsey R. Raymond. “Generative AI at Work.” Quarterly Journal of Economics 140, no. 2 (2025): 889–942. https://academic.oup.com/qje/article/140/2/889/7990658
Bureau of Economic Analysis. National Income and Product Accounts, Table 1.5.2 (contributions to percent change in real GDP, expanded detail) and real private fixed investment in computers and peripheral equipment (B935RC1Q027SBEA). Accessed September 2026. https://apps.bea.gov/iTable/
Bureau of Labor Statistics. Producer Price Index by Industry: Computer and Peripheral Equipment Manufacturing (PCU33413341); Current Employment Statistics, total nonfarm and construction employment (PAYEMS, USCONS); Job Openings and Labor Turnover Survey, layoffs and discharges. Via FRED, Federal Reserve Bank of St. Louis. Accessed September 2026. https://fred.stlouisfed.org
Cboe. “Week of 8/10/2026: SPX Skew Collapses on Upside Chasing.” Cboe Insights, August 2026. https://www.cboe.com/insights/posts/week-of-8-10-2026-spx-skew-collapses-on-upside-chasing
Census Bureau. “Large Firms With at Least 20 Employees Biggest AI Users.” Business Trends and Outlook Survey, May 2026. https://www.census.gov/library/stories/2026/05/ai-use-businesses.html
Census Bureau. Value of Private Construction Put in Place: data centers, monthly, not seasonally adjusted, in constant 2021 dollars. Via Our World in Data, https://ourworldindata.org/grapher/monthly-spending-data-center-us, retrieved 14 September 2026.
Challenger, Gray & Christmas. “2025 Year-End Report: Highest Q4 Layoffs Since 2008; Lowest YTD Hiring Since 2010.” January 2026. https://www.challengergray.com/blog/2025-year-end-challenger-report-highest-q4-layoffs-since-2008-lowest-ytd-hiring-since-2010/
CNBC. “Allbirds Pivots from Shoes to AI, BIRD Stock Soars.” April 15, 2026. https://www.cnbc.com/2026/04/15/allbirds-bird-stock-shoes-ai.html
Council of Economic Advisers. Economic Report of the President, 2003. Washington, DC: U.S. Government Printing Office, 2003.
Crafts, Nicholas. “Steam as a General Purpose Technology: A Growth Accounting Perspective.” Economic Journal 114, no. 495 (2004): 338–351.
David, Paul A., and Gavin Wright. “General Purpose Technologies and Surges in Productivity: Historical Reflections on the Future of the ICT Revolution.” Oxford University Discussion Papers in Economic and Social History, No. 33, 1999.
Donaldson, Dave, and Richard Hornbeck. “Railroads and American Economic Growth: A ‘Market Access’ Approach.” Quarterly Journal of Economics 131, no. 2 (2016): 799–858.
The Economist. “AI Revenues Are Growing Fast, but Not Fast Enough.” July 28, 2026. https://www.economist.com/finance-and-economics/2026/07/28/ai-revenues-are-growing-fast-but-not-fast-enough
Elder, Bryce. “Nvidia’s $200bn ‘Balance Sheet-as-a-Service’.” Financial Times (Alphaville), August 25, 2026. https://www.ft.com/content/9a6947bf-9d4e-4489-80b9-2178ea657a67
Epoch AI. “Total Cost of Ownership of a One-Gigawatt AI Data Center.” Data Insights, 2026. https://epoch.ai/data-insights/ai-datacenter-cost-breakdown
Exponential View. AI capital-expenditure and funding-mix series for the seven largest builders. 2026.
Federal Reserve Bank of St. Louis. “Measuring AI Adoption among Firms: How You Ask Matters.” On the Economy, June 2026. https://www.stlouisfed.org/on-the-economy/2026/jun/measuring-ai-adoption-firms-how-you-ask-matters
Fernald, John, and Shanthi Ramnath. “The Acceleration in U.S. Total Factor Productivity after 1995: The Role of Information Technology.” Chicago Fed Letter, No. 193, Federal Reserve Bank of Chicago, August 2003.
Financial Times. “A Leaderboard of the Biggest Trading Losses of All Time.” 2026. https://www.ft.com/content/340bf9e7-0e67-4d19-b671-3dc8186efb99
Fogel, Robert William. Railroads and American Economic Growth: Essays in Econometric History. Baltimore: Johns Hopkins University Press, 1964.
Goldman Sachs. “How AI Debt Is Reshaping Credit Markets.” Goldman Sachs Exchanges, featuring Amanda Lynam and Zach Ablon, August 3, 2026. https://www.goldmansachs.com/insights/goldman-sachs-exchanges/how-ai-debt-is-reshaping-the-credit-market
Gordon, Robert J. “Does the ‘New Economy’ Measure up to the Great Inventions of the Past?” Journal of Economic Perspectives 14, no. 4 (2000): 49–74.
Hawke, G. R. Railways and Economic Growth in England and Wales, 1840–1870. Oxford: Clarendon Press, 1970.
Hornbeck, Richard, and Martin Rotemberg. “Railroads, Market Access, and Aggregate Productivity Growth.” Working paper, University of Chicago and New York University, 2021.
Indeed Hiring Lab. “The US Tech Hiring Freeze Continues.” 2025. https://hiringlab.indeed.com/2025/07/30/the-us-tech-hiring-freeze-continues/
J.P. Morgan Asset Management. “How Is AI Being Monetized?” On the Minds of Investors, January 9, 2026. https://am.jpmorgan.com/us/en/asset-management/adv/insights/market-insights/market-updates/on-the-minds-of-investors/how-is-ai-being-monetized/
Jorgenson, Dale W. “Information Technology and the U.S. Economy.” American Economic Review 91, no. 1 (2001): 1–32.
Korea Herald (Yonhap). “Daily Turnover of Single-Stock Leveraged ETFs Falls below 1 Trillion Won after Curbs.” August 5, 2026. https://www.koreaherald.com/article/10832181
Lambert, Peter John, and Yannick Schindler. “The Broken Ladder: AI, Remote Work, and Early-Career Hiring.” University of Warwick, London School of Economics, and Ellison Institute of Technology, May 2026. https://papers.ssrn.com/sol3/papers.cfm?abstract_id=6787638
Liu, Jessica, and Douglas Webber. “AI Adoption and Firms’ Job Posting Behavior.” FEDS Notes, Board of Governors of the Federal Reserve System, March 27, 2026. https://www.federalreserve.gov/econres/notes/feds-notes/ai-adoption-and-firms-job-posting-behavior-20260327.html
Nassauer, Sarah, and Theo Francis. “Corporate America’s Profits Are Booming—and Signal More Good Times Ahead.” Wall Street Journal, August 31, 2026. https://www.wsj.com/business/earnings/corporate-profit-america-44836dc6
Nunn, Ryan. “AI Is Probably Not (Yet) the Reason for Labor Market Weakening.” The Budget Lab at Yale, May 7, 2026. https://budgetlab.yale.edu/research/ai-probably-not-yet-reason-labor-market-weakening
Odlyzko, Andrew. “The British Railway Mania of the 1840s.” University of Minnesota. https://www-users.cse.umn.edu/~odlyzko/doc/hallucinations.pdf
Odlyzko, Andrew. “The Collapse of the Railway Mania, the Development of Capital Markets, and Robert Lucas Nash, a Forgotten Pioneer of Accounting and Financial Analysis.” University of Minnesota, 2011. https://www-users.cse.umn.edu/~odlyzko/doc/mania02.pdf
Oliner, Stephen D., and Daniel E. Sichel. “The Resurgence of Growth in the Late 1990s: Is Information Technology the Story?” Journal of Economic Perspectives 14, no. 4 (2000): 3–22.
Ozimek, Adam, and Nathan Goldschlag. “AI and Young Adult Jobs: The Real Mystery.” Economic Innovation Group, March 5, 2026. https://eig.org/ai-and-young-adult-jobs-the-real-mystery/
Resume.org. “The Great Turnover: 9 in 10 Companies Plan To Hire in 2026, Yet 6 in 10 Will Have Layoffs.” Survey of 1,000 U.S. hiring managers, fielded via Pollfish in December 2025, released January 6, 2026. https://www.prnewswire.com/news-releases/resumeorg-survey-the-great-turnover-9-in-10-companies-plan-to-hire-in-2026-yet-6-in-10-will-have-layoffs-302654255.html
Rungcharoenkitkul, Phurichai. “The AI Investment Race.” BIS Working Papers No. 1367, Bank for International Settlements, July 2026. https://www.bis.org/publ/work1367.pdf
Schubert, Gregor. “Organizational Technology Ladders: Remote Work and Generative AI Adoption.” 2026. https://papers.ssrn.com/sol3/papers.cfm?abstract_id=5094265
Seeking Alpha. “KOSPI Crashes 44%, Down 22% Just in Past Two Days.” July 2026. https://seekingalpha.com/news/4621708-kospi-crashes-44-percent-down-22-percent-just-in-past-two-days
Shiller, Robert J. Cyclically adjusted price-earnings ratio, annual series, via multpl.com. Accessed September 2026. https://www.multpl.com/shiller-pe/table/by-year
Société Générale Cross Asset Research. Single-stock leveraged-ETF assets data, via Bloomberg. 2026.
Syverson, Chad. “Understanding AI and Productivity.” Economic Innovation Group, August 2026. https://eig.org/wp-content/uploads/2026/08/TAWP-Syverson.pdf
Visible Alpha. Hyperscaler free-cash-flow and capital-expenditure series, with company filings. 2026.
Wall Street Journal. “Why Big Tech’s AI Spending Is $3 Trillion Higher Than It Seems.” August 2026. https://www.wsj.com/tech/ai/why-big-techs-ai-spending-is-3-trillion-higher-than-it-seems-e1067bb2
Ward, J. R. The Finance of Canal Building in Eighteenth-Century England. Oxford Historical Monographs. Oxford: Oxford University Press, 1974.
You, Josh, and Lynette Bye. “An Update on AI’s Most Important Number.” Epoch AI, August 27, 2026. https://epoch.ai/gradient-updates/an-update-on-ais-most-important-number